Where New Zealand stands internationally: A comparison of offence profiles and recidivism rates
Author: Marcus Boomen, Policy Adviser, Department of Corrections
Author biography: Marcus started as a policy adviser at Corrections in September 2017, and has been focused on how New Zealand justice settings compare to overseas jurisdictions. Before coming to Corrections, Marcus taught at the University of Canterbury while completing his masters in political science. His thesis analysed patterns of violence and the recording of atrocities in war-time Papua New Guinea.
Overview
The findings of this paper indicate that New Zealand’s prison population is unusually skewed in terms of sexual and violent offenders.
Compared to 31 jurisdictions in the Council of Europe (CoE), the United States, and Australia, New Zealand’s prisons have the highest percentage of sentenced prisoners convicted of violent (18.5%) and sexual (25.2%) offences. The reasons for this are beyond the scope of this paper and require further research. However, one reason might be that the majority (63%) of sexual offenders in New Zealand prisons are serving sentences greater than five years. These statistics underline the challenges of reducing the prison population, and the need for innovative approaches.
This paper also attempts to compare re-offending rates across jurisdictions. However, while Australia’s re-imprisonment rates can legitimately be compared to New Zealand’s, there is not enough data to draw any meaningful conclusions.
New Zealand’s high imprisonment rate
With 197 prisoners per 100,000 population in 2015, as shown in Figure 1 below, New Zealand's incarceration rate far surpasses those of Western European countries. While English-speaking jurisdictions tend to have higher imprisonment rates than continental Europe, New Zealand stands out further with an imprisonment rate surpassing many of those in Eastern Europe also. By 2017, our prison population was 219 prisoners per 100,000, significantly higher than Australia (162) or England/Wales (145).
Figure 1: International Imprisonment rates 2015-2017

Comparing prison offence profiles with international jurisdictions
To understand why New Zealand’s prison population is higher than other developed jurisdictions, comparative analysis of the factors that can influence the prison population is necessary. The following section examines one of those factors – our prison offence profile.
Comparative studies using criminal justice statistics are notoriously difficult to undertake, given the wide range of differences that exist across countries. However, a relatively recent CoE annual penal statistics report (Aebi, Tiago & Burkhardt, 2017) has been sufficiently standardised to allow legitimate comparisons between jurisdictions. It also includes a high level of detail and reliability, and so has been used as the main data source for this report. The CoE also constitutes the majority of the developed world. Together with New Zealand, it includes 76% of the OECD, 57% of high-income countries, and 80% of countries with high human development index scores.[1]
In the latest CoE data set (2015), 29 jurisdictions provided sufficient data on the offence composition of their prison population. This was supplemented with data from Australia and the United States. Combined with New Zealand, the data for 32 jurisdictions was examined.
A comparison of prison populations by offence type
Using the international data, Figure 2 below shows the overall breakdown (by percentage) of each jurisdiction’s prison population by the lead offence type.[2] This is intended to provide a contextual overview of the different types of prison compositions. Figure 3 draws out select jurisdictions which characterise different types of prisoner compositions.
Figure 2: Overall composition of sentenced prison population (prison profile) by lead offence type, 01/11/2015[3]
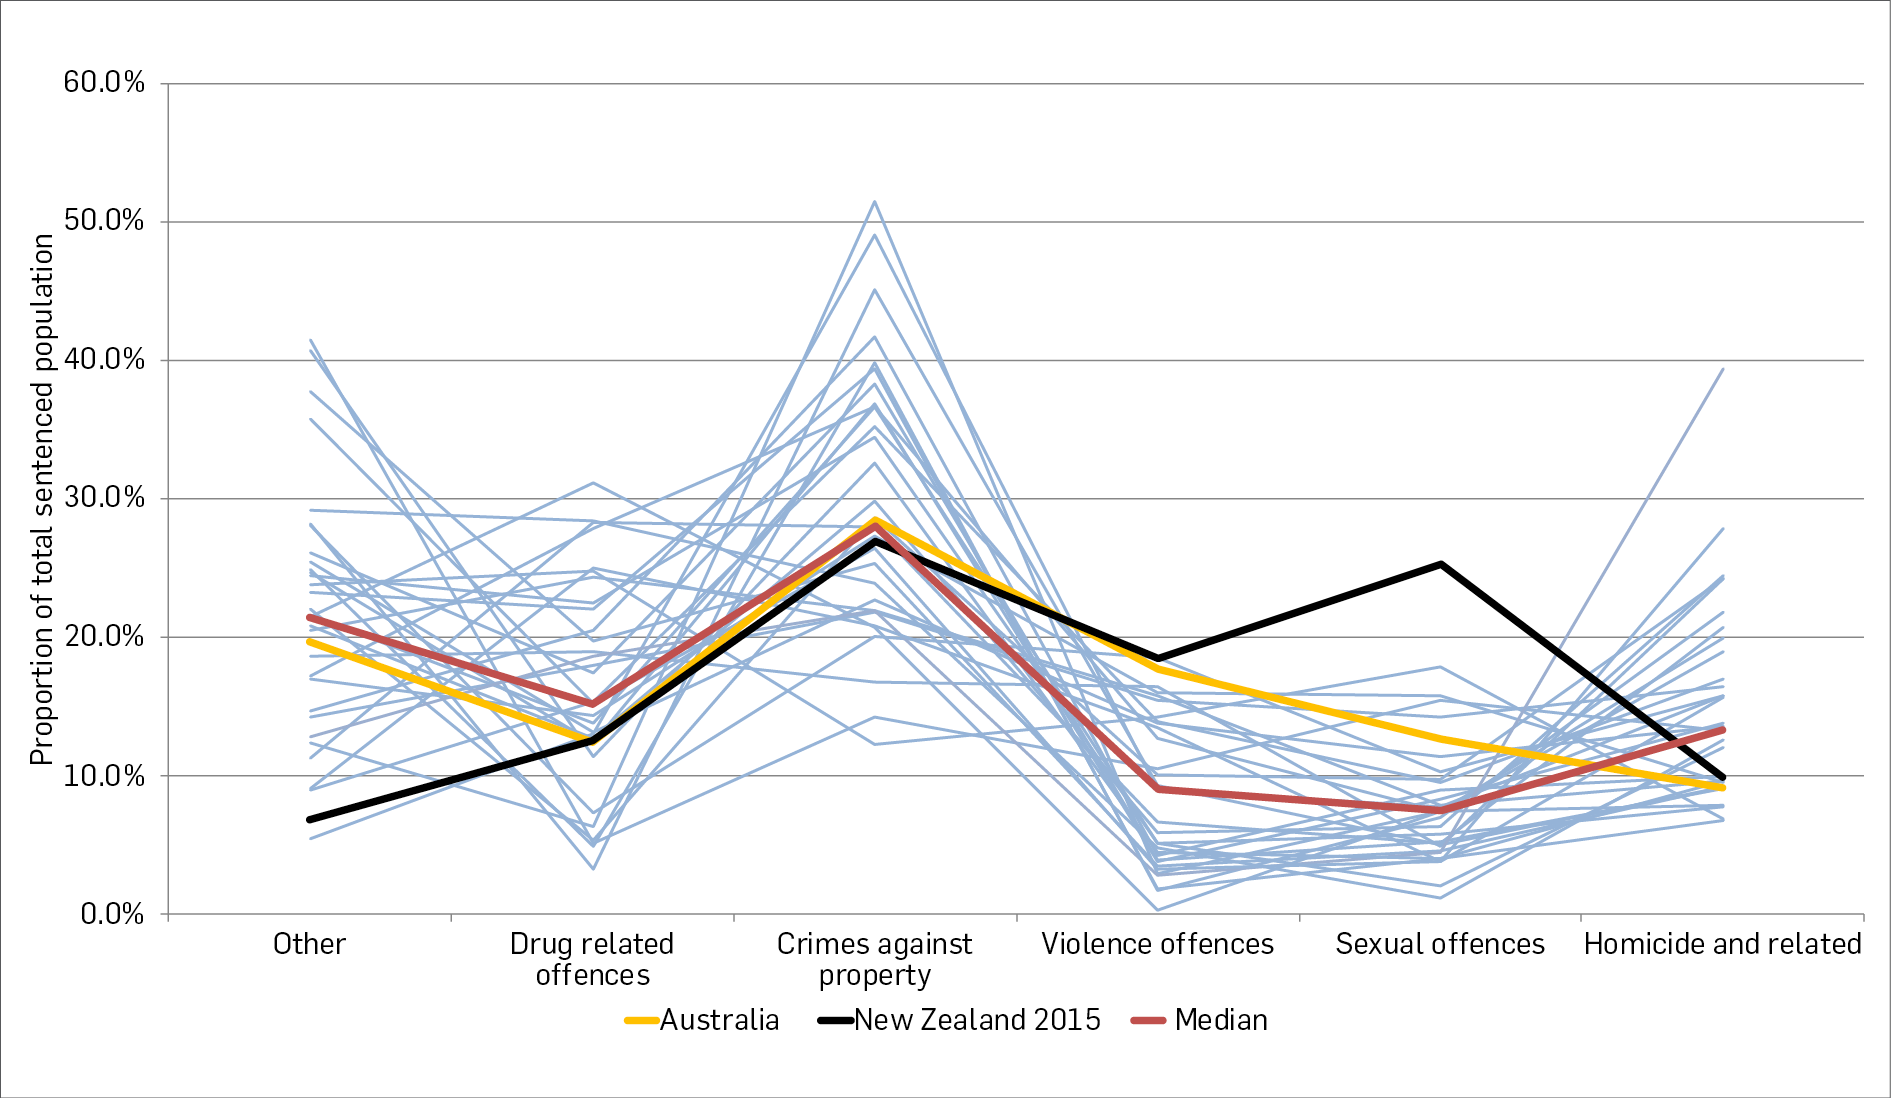
Figure 3: Archtypes of patterns within international jurisdictions prison profiles, 01/11/2015
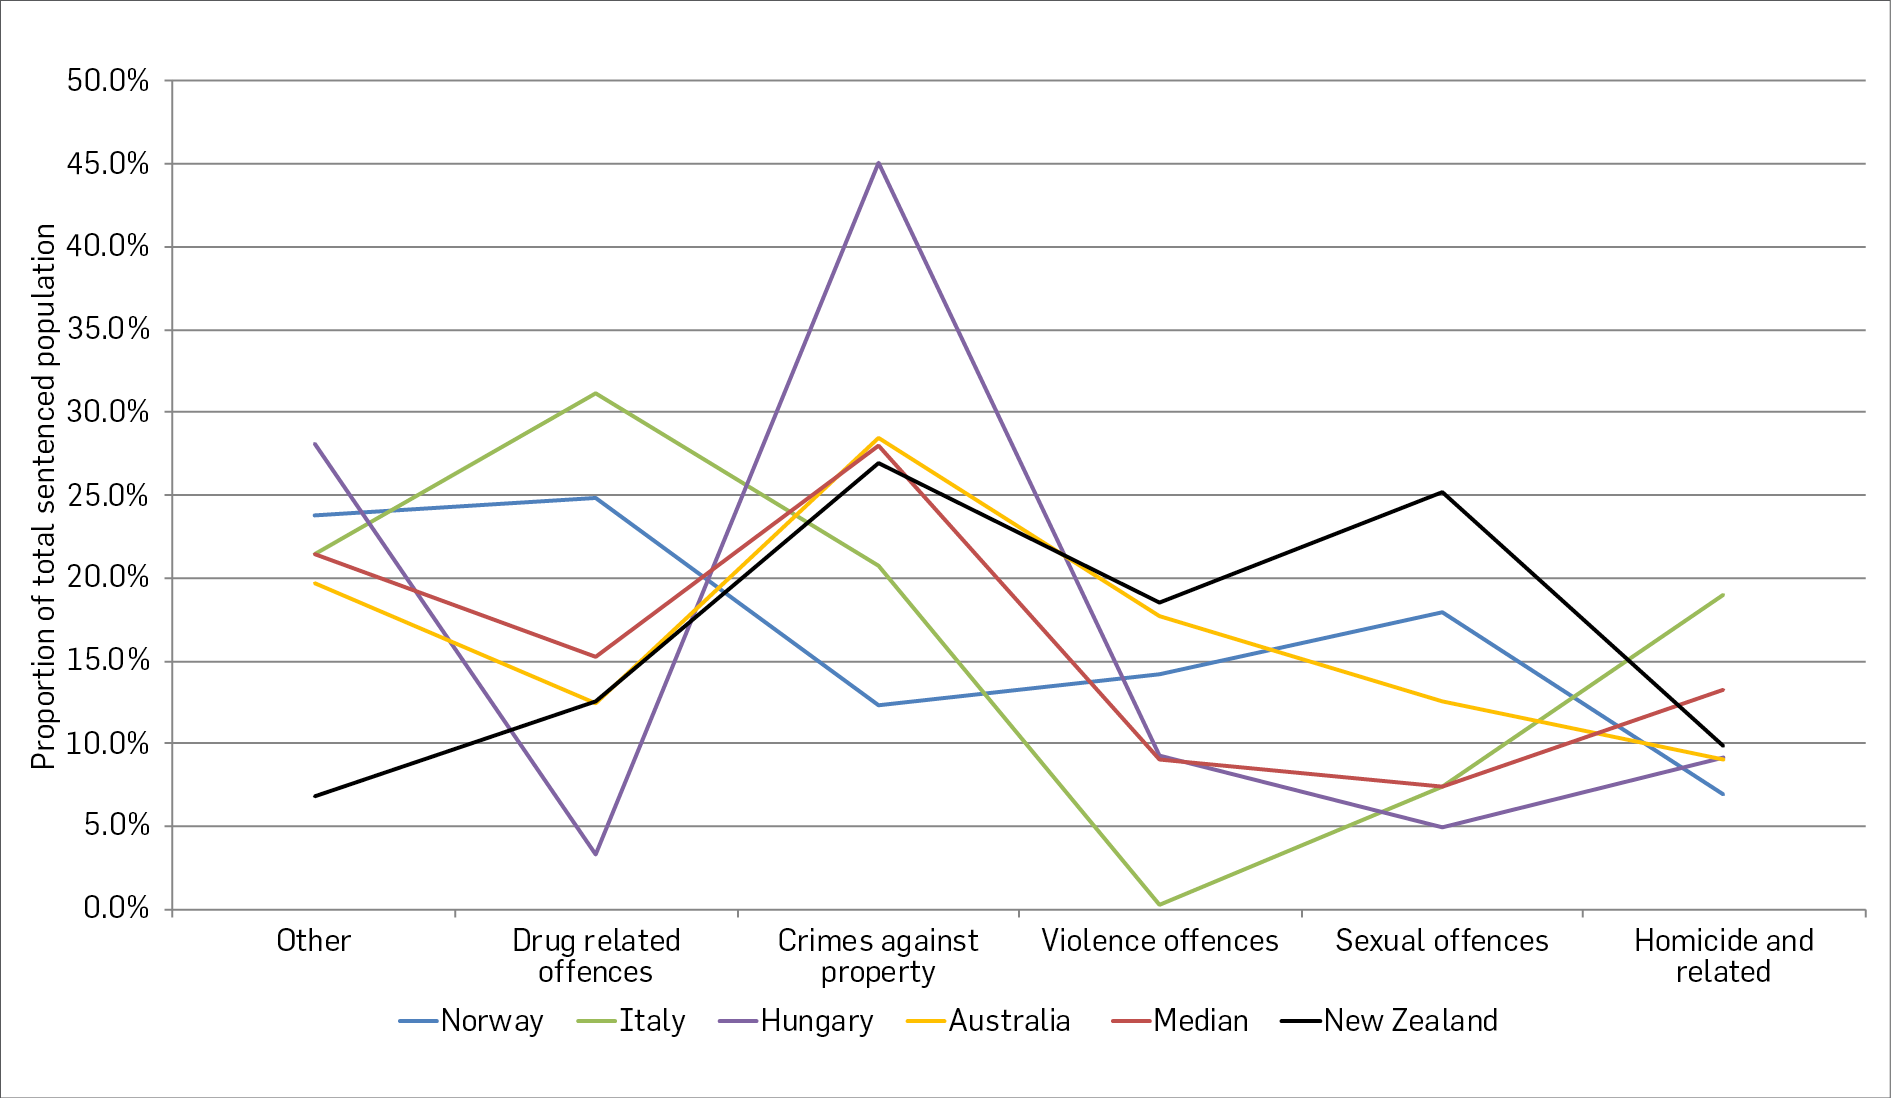
Italy’s offence profile is typical of jurisdictions with high numbers of drug-related offenders, who make up 31% of its prisoners. This is important as many jurisdictions have been able to target this non-violent cohort to reduce their prison populations. In the past, this has included mass amnesties in Georgia and Italy, decreasing technical violations and recalls in Texas, decriminalising drugs in Portugal, and increased correctional based drug treatment programs in Singapore (Ruggiero & Ryan, 2013; Helliwell, 2011; CSGJC, 2009; Laqueur, 2015).
Hungary’s offence profile is characteristic of many countries in Eastern Europe, such as Latvia, Georgia, and Romania; 45.1% of its prison population was reportedly sentenced for crimes against property.
Norway demonstrates the profile of a jurisdiction that has already implemented successful reform. With fewer prisoners incarcerated for property or drug offences, 17.9% of its prisoners are on sentence for sexual offences. This is the second highest in the CoE. For similar reasons, Denmark has the fifth highest proportion of people sentenced for violence, while Finland has the fifth highest proportion imprisoned for homicide and related offences.
Australia is the jurisdiction most similar to New Zealand. While less pronounced than in New Zealand, Australia shows similar features with high proportions of sexual and violent offenders. This is also observed in England/Wales, and Northern Ireland.
Table 1 shows how New Zealand’s offence profile compares to that of the other jurisdictions. Of all 32 examined, New Zealand had the highest proportion of violent offenders.[4] New Zealand prisons also contain a much higher proportion of sexual offenders than any other jurisdiction. They make up 30% more of the prison population than in Norway, and almost three times the median. Finally, when these categories were combined with that for homicide (and related offences) into one for all “interpersonal violence”,[5] New Zealand still recorded the highest proportion of prisoners of this type.
Table 1: Proportion of prisoners by lead offence type (01/11/2015)
Offence category | Highest | 2nd highest | 3rd highest | Median for 32 countries included in sample |
|---|---|---|---|---|
Violence offences | 18.5% (New Zealand) | 18.4% (Northern Ireland) | 17.7% (Australia) | 6.6% |
Sexual offences | 25.2% (New Zealand) | 17.9% (Norway) | 15.8% (England/Wales) | 7.3% |
Interpersonal offences | 53.6%[6] (New Zealand) | 46.6% (Albania) | 46% (United States) | 33.2% |
Comparing prison populations by per capita imprisonment rates
The results of Table 1 do not preclude the possibility that New Zealand has an offender composition driven by the same use of “prison as a last resort for the most serious offenders”, as outlined above, in Finland or Norway. This possibility can be addressed by examining the data as a function of offenders per capita. Doing this shows it to be unlikely that we are similar to jurisdictions like Finland.
For every 100,000 people in New Zealand, 38.3 were in prison for sexual offences in 2015. In the Nordic countries this ranges from 2.1 to 9.2 per 100,000. Figure 4 depicts these per capita rates in more detail.
Figure 4: Prisoners per capita by offence type 01/11/2015
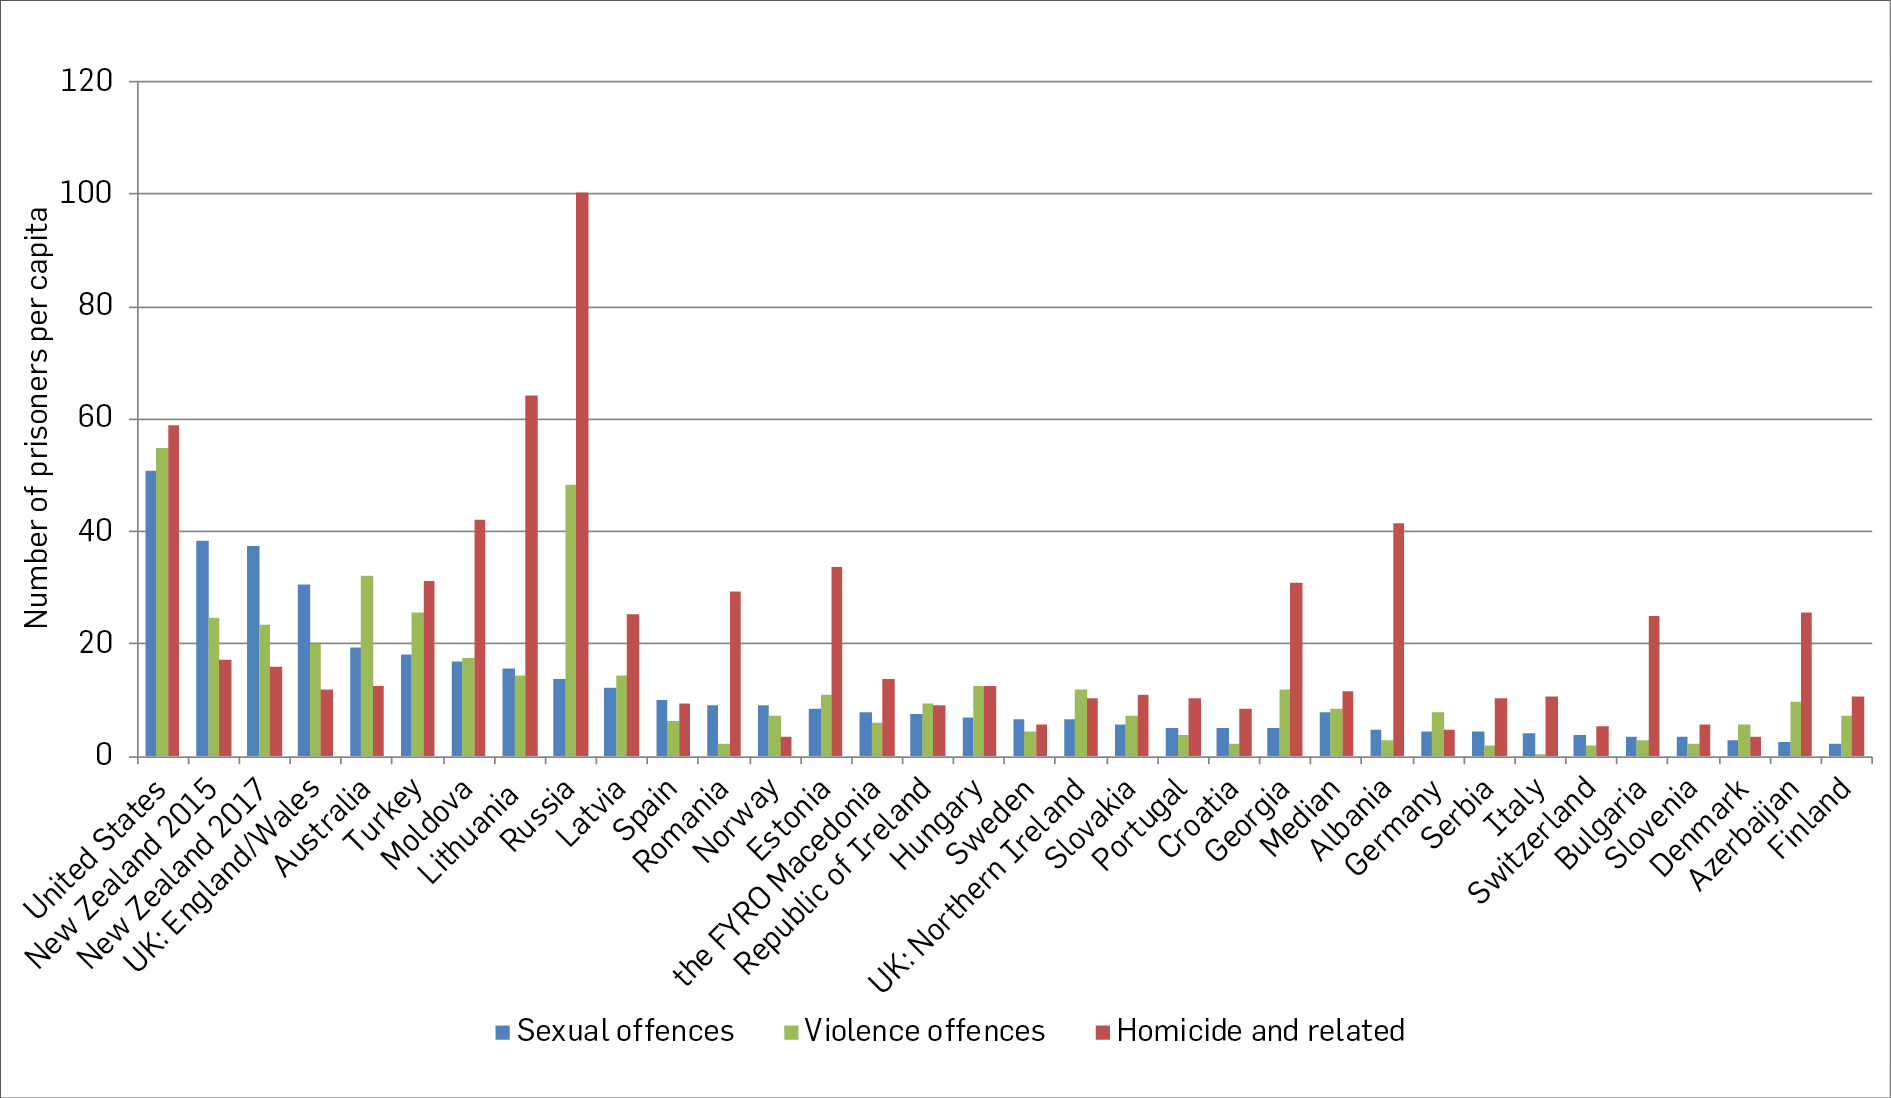
Table 2: Per capita rate of prisoners by lead offence type 01/11/2015
Offence category | Highest | 2nd highest | 3rd highest | 4th Highest | 5th Highest | Median |
|---|---|---|---|---|---|---|
Violence offences | 55.0 (United States) | 48.4 (Russia) | 32.2 (Australia) | 25.7 (Turkey) | 24.5 (New Zealand) | 7.6 |
Sexual offences | 50.7 (United States) | 38.3 (New Zealand) | 30.7 (England/Wales) | 19.5 (Australia) | 18 (Turkey) | 6.7 |
Homicide and related | 100 (Russia) | 64.3 (Lithuania) | 58.8 (United States) | 42.2 (Moldova) | 41.4 (Albania) | 12.2 |
Total Interpersonal offences | 164.5 (United States) | 162.5 (Russia) | 94 (Lithuania) | 80.2 (New Zealand) | 76.6 (Moldova) | 30.2 |
The divergence between New Zealand and the median number of sexual offenders is even higher in Table 2 than in Table 1, growing from nearly four to six times the median. Of all 33 jurisdictions, New Zealand has high proportions per capita of people imprisoned for sexual and violence offences. Only in regard to homicide and related offences do we rank lower, at thirteenth place with 17.3 offenders per 100,000.
The composition of New Zealand’s prison population – a deeper examination
The data presented here do not explain why New Zealand has such high proportions of sexual and violent offenders. To shed further light on these findings, the mix of offence types by length of imposed sentence and throughput also needs to be examined. The following graph gives some indication of New Zealand’s prisoner population via this lens.
Figure 5: Snapshot of New Zealand prisoners by offence type and sentence length 01/11/2015
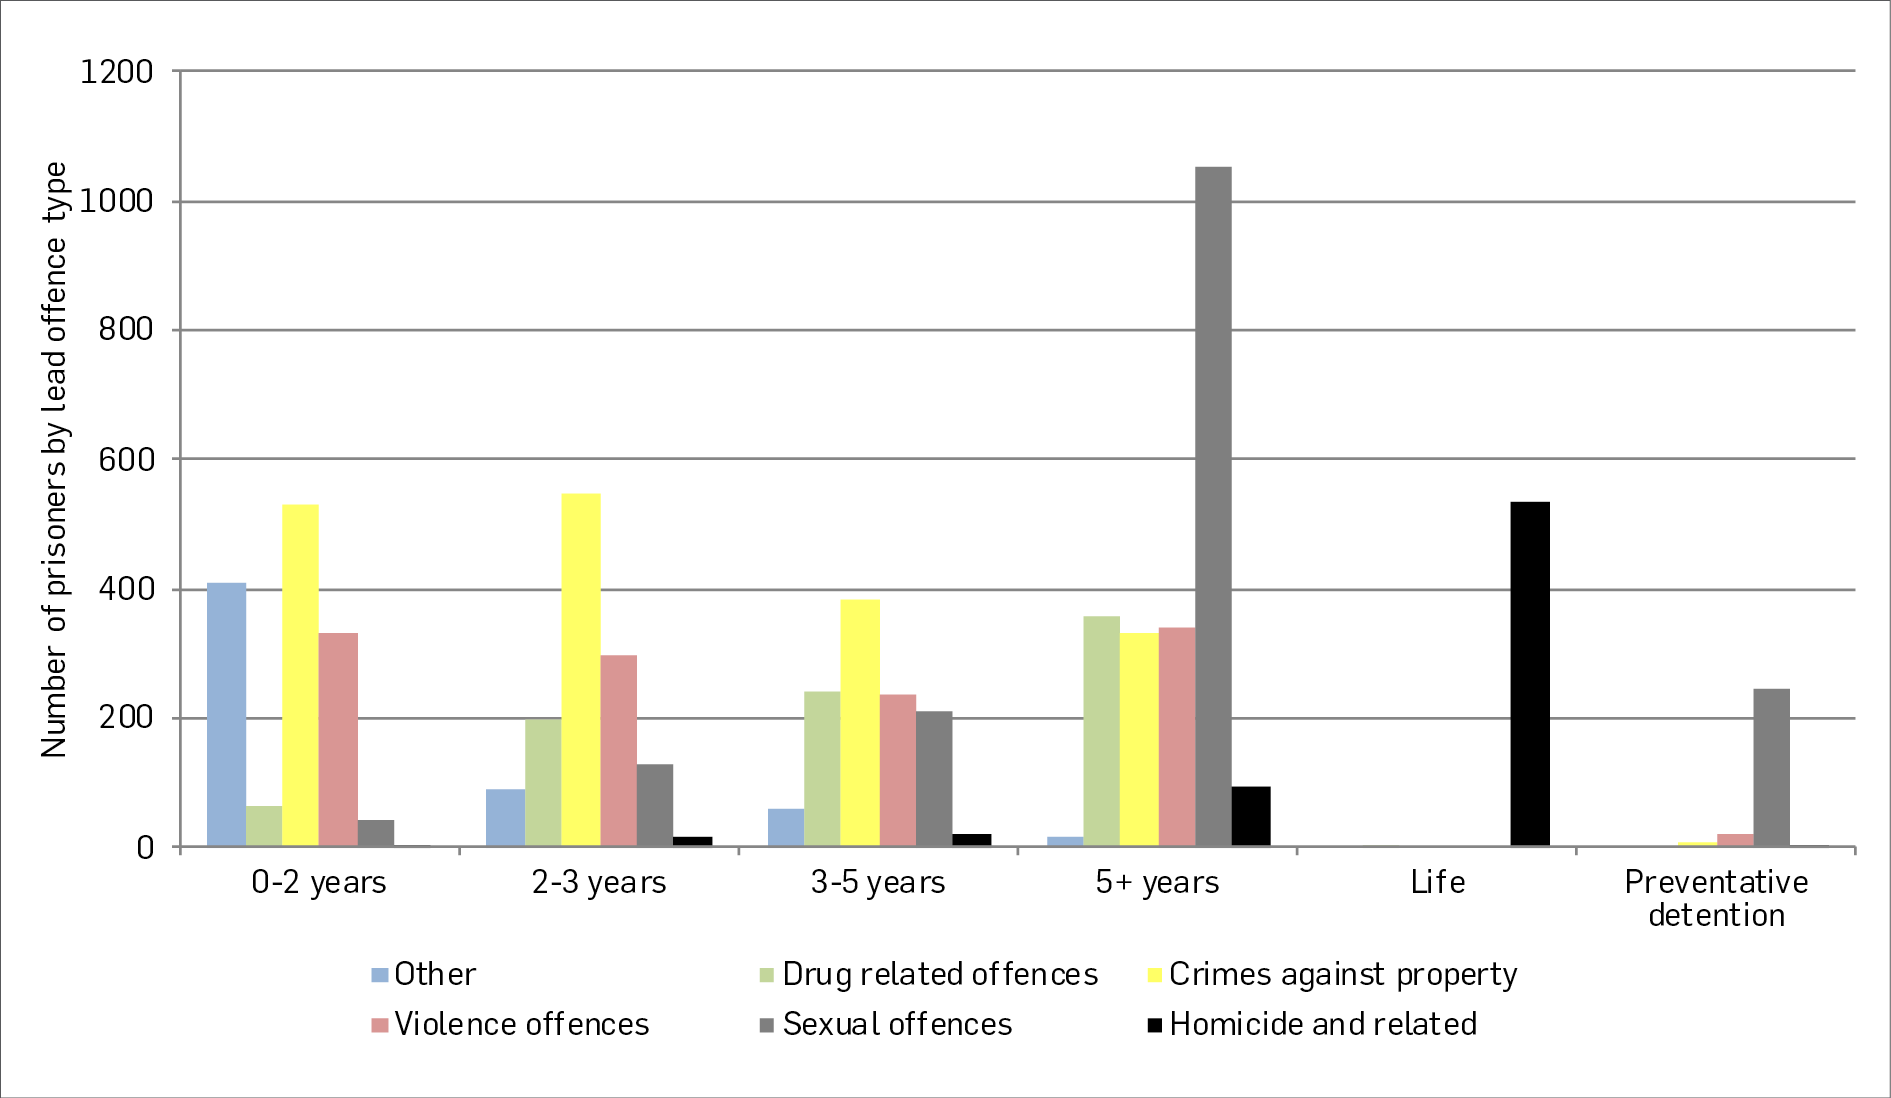
This graph depicts a snapshot of New Zealand’s prisons on 1 November 2015. While comparative data for other jurisdictions is not available, Figure 5 helps to further contextualise the composition of New Zealand’s prisoner profile.
The most notable feature is that those sentenced for sexual offending are mostly serving relatively long sentences. Of all sexual offenders in prison at that time, 63% were sentenced to more than five years.
Given such a high proportion of sexual offenders are in New Zealand prisons, and the fact that they are mostly serving very long sentences, two hypotheses present: that similar offenders in other jurisdictions spend less time in prison, and/or New Zealand has larger numbers of these offenders entering prison. Unfortunately, we do not have the data to answer these questions, however, these results cast some doubt on the idea that tough New Zealand sentencing practices alone are the cause. For this to be true sexual offenders serious enough to get more than five years in New Zealand would have to be diverted from prison in other jurisdictions, or would serve a sentence so short they would churn through the system without resulting in high prisoner numbers. More research is needed to answer these questions.
Comparing recidivism rates
An attempt was made to compare reconviction and reimprisonment rates across jurisdictions, to discover if these rates affect prisoner composition. However, attempting to compare these types of statistics is fraught with problems. Apparent differences in rates can arise due to the make-up of the cohorts, the length of time over which re-offending is measured, and the actual measure of re-offending itself. The lack of comparable data limits the usefulness of any comparison.
A project to standardise reconviction reporting by the CoE demonstrates how much small differences in reporting methods matter (Albrecht & Jehle, 2016). The study examined the recidivism statistics for Scotland, England/Wales, and the Netherlands. All three reported two-year reconviction rates. However, when their reporting practices were standardised the results changed significantly.
Table 3: Results of the CoE standardisation program for reconviction data (2004)[7]
| England/Wales | Scotland | Netherlands |
|---|---|---|---|
Original recidivism data | 54.7% reconvicted | 44.6% reconvicted | 29.3% reconvicted |
Adjusted recidivism data | 45.1% reconvicted | 44.3% reconvicted | 38.0% reconvicted |
Appendix 1 provides some details on recidivism data in nine jurisdictions. This demonstrates high-level differences in methodologies to further demonstrate the inconsistencies that make comparisons problematic.
The only data identified that was comparable to New Zealand were the two-year reimprisonment rates of Australian jurisdictions, where significant effort to achieve methodological standardisation has occurred.
Figure 6: 24 month reimprisonment rate of Australasian offenders released in 2013/14-2015/16
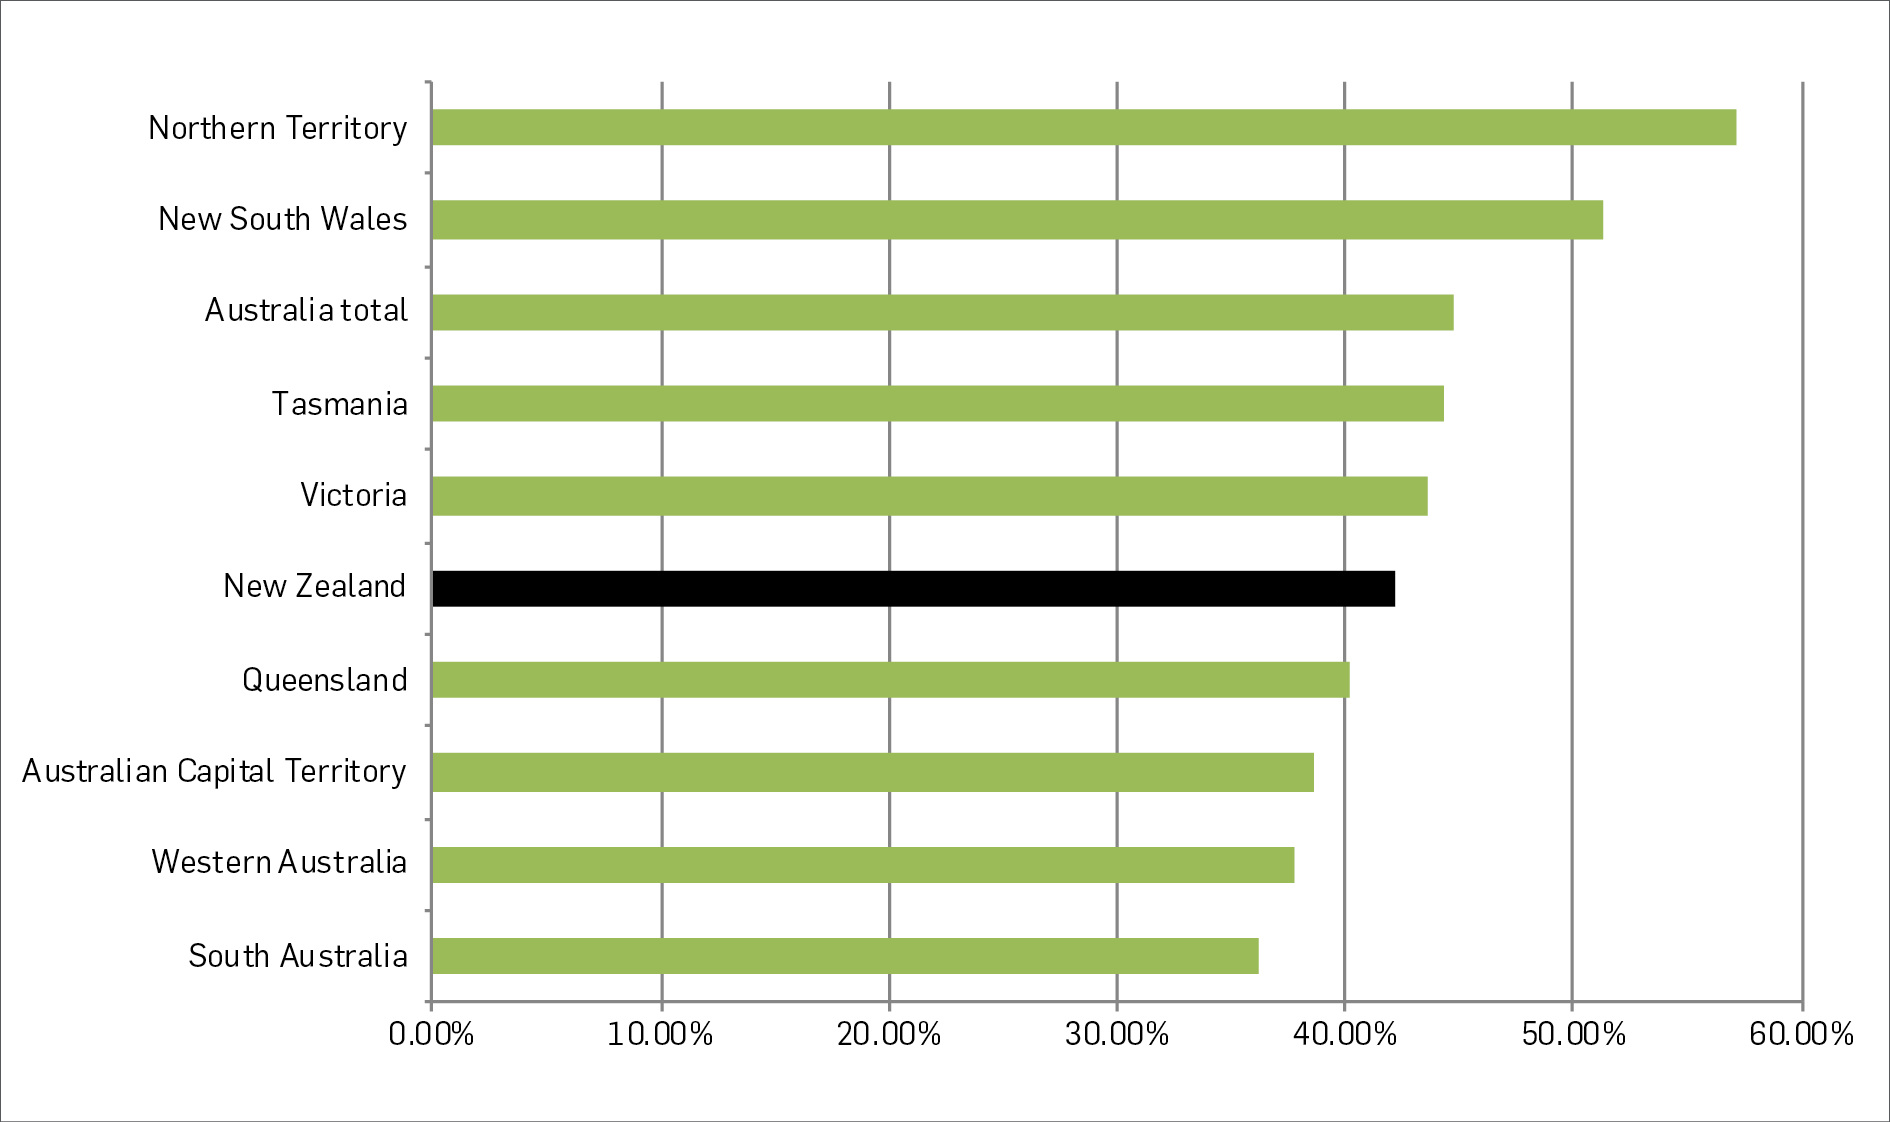
Figure 6 reveals that the 24 month reimprisonment rate for New Zealand is in the mid-range when compared to the eight Australian states and territories. However, only limited conclusions can be drawn from such a comparison, since it offers no global context. The available data is also insufficient to determine the reasons for variation between the jurisdictions.
For this reason, no conclusions can be drawn concerning the relationship between recidivism rates and prisoner composition.
Conclusion
The limited scope of this paper restricts the strength of the conclusions that can be drawn. However, from the evidence outlined, across the set of countries included in this analysis, New Zealand has:
- one of the highest imprisonment rates in the developed world
- the highest proportion (53%) of offenders in prison for interpersonal offences
- the highest proportion of sexual offenders in prison (25%)
- the second highest rate of incarcerated sexual offenders per capita (38 per 100,000 people)
- the fifth highest number of offenders incarcerated for violence offences per capita (24 per 100,000 people)
- a high proportion of sexual offenders serving long sentences (63% of sexual offenders in prison had sentences of five years or more), which may explain why they form a relatively high proportion of the total.
It must be acknowledged, however, that much of the available recidivism data are not comparable and what is available does not support firm conclusions.
With a high prison population rate, it is clear that some features of crime and justice in New Zealand are problematic. One of these areas is the disproportionate number of people in prison for interpersonal violence. Understanding what drives this requires more research. It may be due to the nature of our judicial settings, it could mean there is a concerted effort to tackle normally under-reported violence, or it may be as a result of some feature of the nature of crime in New Zealand.
Regardless, the high proportion of prisoners sentenced for violence offences means New Zealand lacks the same high numbers of non-violent offenders other jurisdictions (such as Texas, Portugal, Georgia, and Italy) have targeted to reduce their prison numbers. Therefore, policies from such jurisdictions may have limited transferability to New Zealand.
References
Aebi, M. F., Tiago, M. M., Burkhardt, C. (2017). Council of Europe Annual Penal Statistics. SPACE I- Prison Populations Survey 2015. Report prepared for the Council of Europe by University of Lausanne, Switzerland
Albrecht, H. J., & Jehle, J. M. (2016). National Reconviction Statistics and Studies in Europe= Nationale Rückfallstatistiken und-untersuchungen in Europa. Universitätsverlag Göttingen.
Australian Government Productivity Commission, (2018). Last viewed 20/03/2018 https://www.pc.gov.au/research/ongoing/report-on-government-services/2018/justice#attachtables
Central Statistics Office, (2016). Last viewed 16/04/2018 http://www.cso.ie/en/releasesandpublications/er/prir/prisonrecidivism2010cohort/
Department of Justice, (2017). Last viewed 16/04/2018 https://www.justice-ni.gov.uk/sites/default/files/publications/justice/r-bulletin-29-2017-adult-and-youth-re-offending-northern-ireland-201415-cohort.pdf
Helliwell, J. (2011). Institutions as enablers of wellbeing: The Singapore prison case study. International Journal of Wellbeing, 1(2), pg. 255-265.
Laqueur, H. (2015). Uses and Abuses of Drug Decriminalization in Portugal. Law & Social Inquiry, 40(3), 756-781.
Ministry of Justice, (2018). Last viewed 16/04/2018 https://assets.publishing.service.gov.uk/government/uploads/system/uploads/attachment_data/file/676431/proven-reoffending-bulletin-jan16-mar16.pdf
Research and Documentation Centre, (2016). Last viewed 16/04/2018 https://english.wodc.nl/binaries/FS%202016-1a_tcm29-266946.pdf
Ruggiero, V. & Ryan, M. (2013). Punishment in Europe, a critical anatomy of penal systems. New York, United States of America: Palgrave Macmillan.
Scottish Government, (2017), Last viewed 16/04/2018 http://www.gov.scot/Resource/0051/00517255.pdf
Statistics Denmark, (n.d.). Last viewed 16/04/2018 https://www.dst.dk/en/Statistik/emner/levevilkaar/kriminalitet/tilbagefald-til-kriminalitet
Statistik Austria, (2017). Last viewed 16/04/2018 https://www.statistik.at/web_de/statistiken/menschen_und_gesellschaft/soziales/kriminalitaet/index.html
Swedish National Council for Crime Prevention, (n.d.). Last viewed 16/04/2018 https://www.bra.se/bra-in-english/home/crime-and-statistics/crime-statistics/recidivism.html
The Council of State Governments Justice Center, (2009). Assessing the Impact of the 2007 Justice Reinvestment Initiative. New York, United States of America
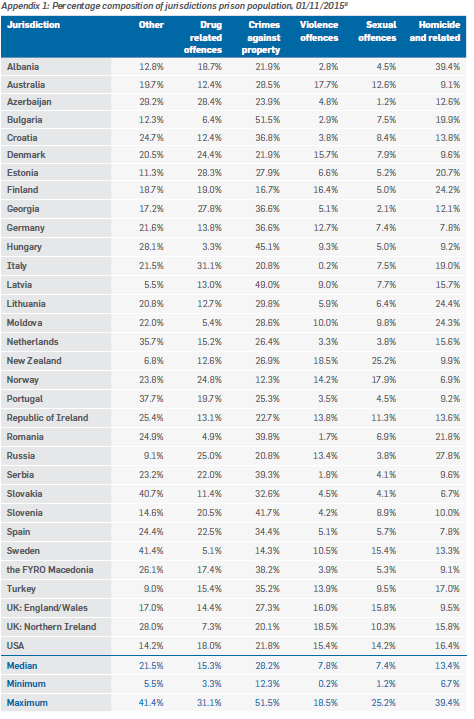
Appendix 1: Percentage composition of jurisdictions prison population, 01/11/2015[8]
Appendix 2: International recidivism rates and reported methodical differences[9]
Jurisdiction | Study period | Sample selection | Length of study | Re-offense criteria | Result |
|---|---|---|---|---|---|
Netherlands (Research and Documentation Centre, 2016) | 2010-2012 | All adult offenders | 2 years | A reconviction confirmed or logged with prosecution service or court. (includes pseudo reconvictions).[10] | 25% reconviction |
Austria (Statistik Austria, 2017) | 2012-2014 | All persons convicted or released from prison | 2 years | Reconviction by Austrian courts | 32% re-sentenced |
England/Wales (Ministry of Justice, 2018) | 2016-2017 | All persons convicted or released from prison between January and march | 1 year +(6 month follow up for case resolution) | Reconviction | 29.6% reconviction |
Scotland (Scottish Government, 2017) | 2013/14-2015/16 | All persons convicted or released from prison (not including breaches) | 2 years | Reconviction (includes pseudo reconvictions), excludes group 6 offences. | 39.9% reconviction |
Northern Ireland (Department of Justice, 2017) | 2014/15-2015/16 | All persons convicted or released from prison (1 financial year) | 1 year +(6 month follow up for case resolution) | Re-offense committed in northern Ireland, excluding breaches. | 16.9% reconviction |
Denmark(Statistics Denmark, n.d.) | 2013-2015 | Danish residence aged 20+ who have been released from prison or have been convicted | 2 years +(1 year follow up for case resolution) | Found guilty under the penal code, road traffic act, or special law/legislation. | Relapse rate 47.7% |
Sweden (Swedish National Council for Crime Prevention, n.d.) | 2009-2012 | Complete court sanction with legal force (includes youth). | 2 years 3 years | Only specified as a relapse. | Relapse rate 34% Relapse rate 40% |
Australia (Australian Government Productivity Commission, 2018) | 2013/14-2015/16 | All released sentenced prisoners | 2 years | Returning to prison, corrective services (including prison) | 44.8% reimprisonment rate 53.4% relapse rate |
Ireland (Central Statistics Office, 2016) | 2010-2015 | All released sentenced prisoners | 3 years | Reconviction (match process) | 45.1% reconvicted |
[1] CoE includes 32 of the top 40 highest scoring countries on the IHDI.
[2] Note that the six offence categories do not use legal definitions but have been validated for consistency (Aebi, Tiago & Burkhardt, 2017). The New Zealand and Australian data uses comparable categories based on the ANZSOC offence classification system. The classification of the US data is less certain.
[3] Data is provided in Appendix 1.
[4] This excludes burglary and aggravated burglary type offences in order to be consistent with the international data.
[5] The offence categories (e.g. “interpersonal offences”) are non-technical terms.
[6] The New Zealand figure is the total of: violence offences (18.5%) + sexual offences (25.2%) + homicide and related offences (9.9%).
[7] Index cases are the original offences from which the “two years” is monitored.
[8] Note this table uses non-legal terminology that may differ from that used in other reports or research.
[9] Relapse rate is reconviction to a prison or community sentence only.
[10] Pseudo reconvictions occur when a person is convicted of an offence that occurred before their first offence.