Frequency of re-imprisonments (48-month follow-up)
A proportion of all offenders recorded as having been re-imprisoned during the 48-months follow-up period will in fact have experienced more than one term of imprisonment during that period. The figures reported below count distinct “aggregate sentences” for each released prisoner during the 48-month follow-up period. An aggregate sentence of imprisonment reflects the fact that many offenders are sent to prison after being convicted for multiple charges, each of which attracted separate sentences of imprisonment (often of varying lengths). Counting aggregate sentences however may underestimate the frequency of imprisonments, as some prisoners are convicted and imprisoned while in prison, but the second set of convictions may be added to the earlier aggregate sentence.
At this stage analysis of the reimprisonment frequencies for all offence types has not been completed: the current analysis reports on burglars, disqualified drivers and drink drivers.
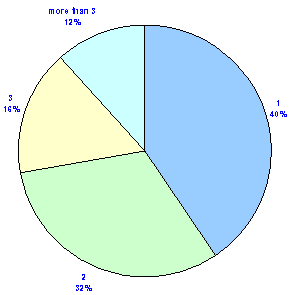
Of the 857 burglars released in 2002/03, 607 were returned to prison during the follow-up period. Of these, 192 were returned to prison twice during the follow-up period, 98 were returned to prison three times and 71 were returned to prison on more than three separate sentences.
Graph 10: Frequency of re-imprisonments, burglars

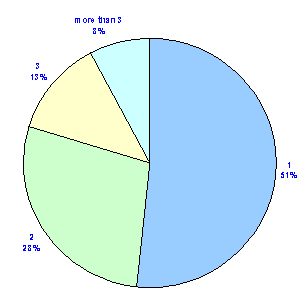
Of the 474 disqualified drivers released in 2002/03, 256 of them were returned to prison at least once during the follow-up period. One hundred and twenty four were returned to prison at least twice during the follow-up period, 52 at least three times and 20 more than three times.
Graph 11: Frequency of re-imprisonments, disqualified drivers

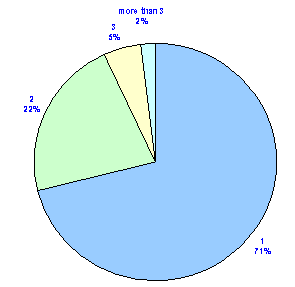
Of the 460 drink-drivers released in 2002/03, 156 of them were returned to prison at least once during the follow-up period. Forty-five were returned to prison at least twice during the follow-up period, 11 at least three times and just 3 were returned to prison more than three times.
Graph 12: Frequency of re-imprisonments, drink-drivers


