Re-imprisonment rates: "first-timers" and "recidivists"
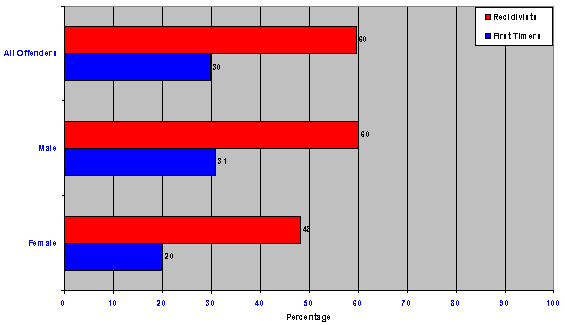
As noted above, across the entire sample of released offenders, about one third had been sent to prison for their first time. The re-imprisonment rate of these first-timers is 30 percent; in contrast, the re-imprisonment rate of the remainder – the recidivists - is 60 percent. Many recidivists appear almost endlessly to cycle through a sequence of offending, conviction, imprisonment, release, and rapid return to further offending.
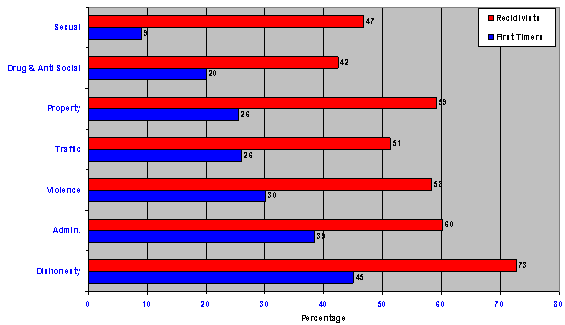
In general reconviction and re-imprisonment rates for sex offenders are low relative to other offence types. However, when disaggregated by previous sentences, this finding does not hold true for the recidivist sex offenders, whose rate of re-imprisonment is 47 percent. This is slightly higher than the rate for recidivist drug offenders (42%), and only slightly lower than for recidivist traffic offenders (51%). Recidivist sex offenders are in fact 5.2 times more likely to return to prison than first-timer sex offenders.
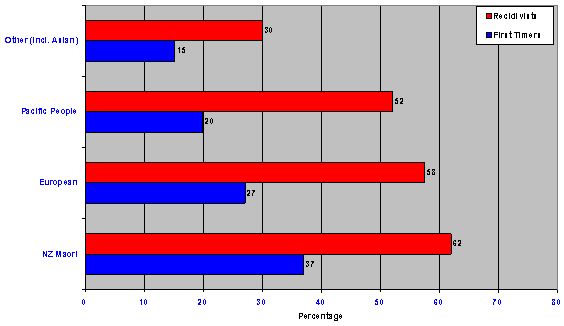
Similarly, as is apparent from Graph 16 below, the rate of re-imprisonment over 48 months for recidivist Pacific offenders (52%) is not much lower than recidivist NZ Europeans (58%) and recidivist Maori offenders (62%). The rate of reconviction (i.e., including convictions resulting in community sentences also) for recidivist Pacific offenders (74%) is only slightly lower than recidivist NZ Europeans (76%), while the rate of reconviction for recidivists Maori offenders is 80 percent over 48 months.
Graph 15: Re-imprisonment rate by most serious offence class: First-timers vs Recidivists
Graph 16: Re-imprisonment rate by ethnicity: First-timers vs Recidivists
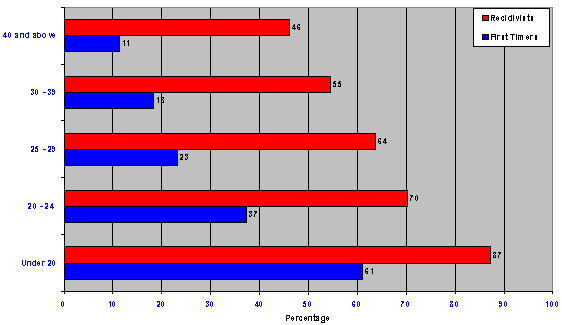
Although there is a high (inverse) correlation between age and re-imprisonment, recidivist offenders tend to have a higher rate of re-imprisonment compared to first-timers regardless of their current age. Recidivist offenders who are over 40 at release are 4.1 times more likely to return to prison than first-timers who are over 40 at release. The graph below clearly shows the difference in rate of re-imprisonment between recidivist offenders and first-timers for each age group at release.
Graph 17: Re-imprisonment rate by age group: First-timers vs Recidivists
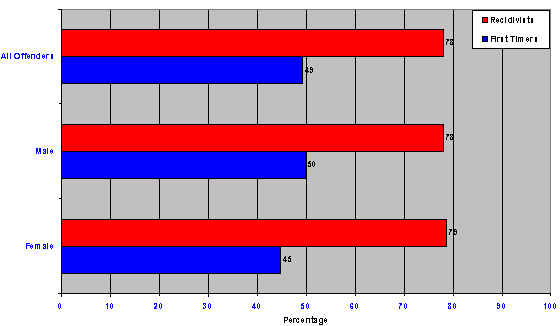
In general, the overall re-imprisonment rate of female offenders (33%) is lower than that of male offenders (50%). The graph below shows some interesting findings in relation to female offenders: the rate of re-imprisonment for recidivist female offenders (48%) is not greatly dissimilar to that of recidivist male offenders (60%). Recidivist female offenders turn out to be 2.4 times more likely to return to prison than first-timer females, while recidivist male offenders are just 1.9 times more likely to return to prison than first-timer males. However, the rate of reconviction for recidivist female offenders (79%) is slightly higher than that for recidivist male offenders (78%). Clearly there is a “hard core” of female offenders who if anything are equally as criminally inclined as their male counterparts.
In summary this analysis shows that, the more often in the past someone has been in prison, the more likely they are to return to prison following any given release.
Graph 18: Re-imprisonment rate by gender: First-timers vs Recidivists
Graph 19: Reconviction rate by gender: First-timers vs Recidivists
