Community-based sentence and order facts and statistics - March 2021
This page shows statistical information on the:
- Number of sentences and orders by area
- Total sentences and orders count
- Breakdown of the offender population by:
The community-based sentences and orders data refers to the total number of sentences and orders being served. An individual offender can be serving more than one sentence and/or order at any time.
Number of sentences and orders by area as at 31 March 2021
| Area | Sentences | Orders | Total |
| Auckland | 2,174 | 621 | 2,795 |
| Bay of Plenty | 1,625 | 371 | 1,996 |
| Canterbury | 2,658 | 698 | 3,356 |
| East Coast | 1,960 | 470 | 2,430 |
| Manukau | 3,291 | 895 | 4,186 |
| Nelson/ West Coast | 1,159 | 158 | 1,317 |
| Otago | 931 | 309 | 1,240 |
| Southland/ Central Otago | 698 | 177 | 875 |
| Taitokerau | 1,594 | 458 | 2,052 |
| Taupo/ Rotorua | 1,361 | 438 | 1,799 |
| Waikato | 2,978 | 782 | 3,760 |
| Wairarapa/ Manawatu | 1,473 | 398 | 1,871 |
| Waitemata | 2,360 | 436 | 2,796 |
| Wellington | 1,835 | 407 | 2,242 |
| Whanganui/ Taranaki | 1,340 | 341 | 1,681 |
| Grand Total | 27,437 | 6,959 | 34,396 |
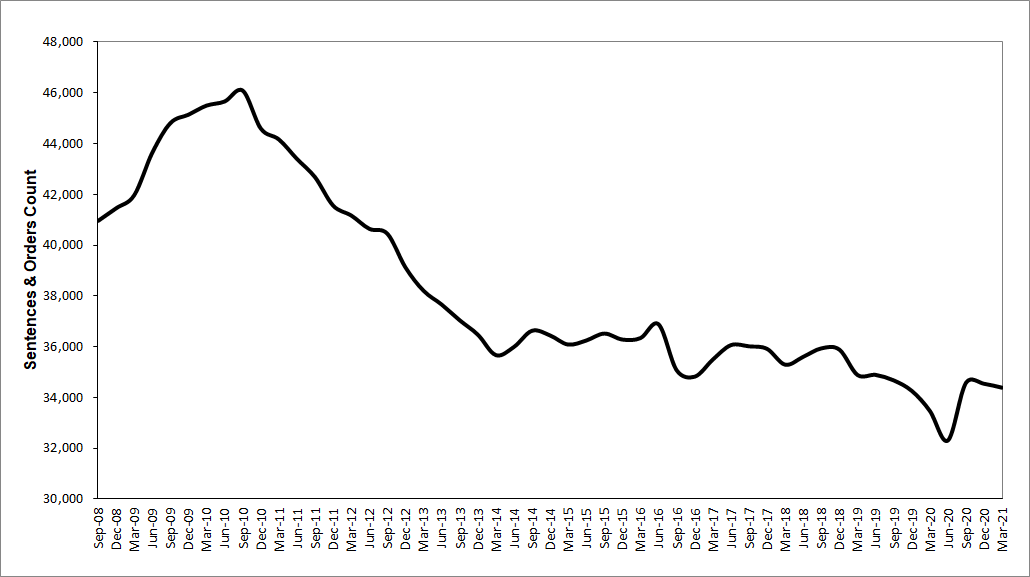
Total number of community-based sentences and orders
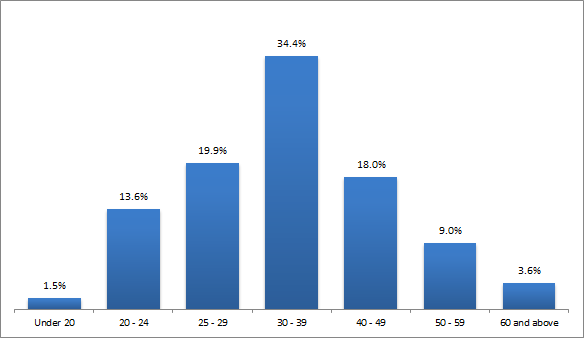
Community-based offenders by age group
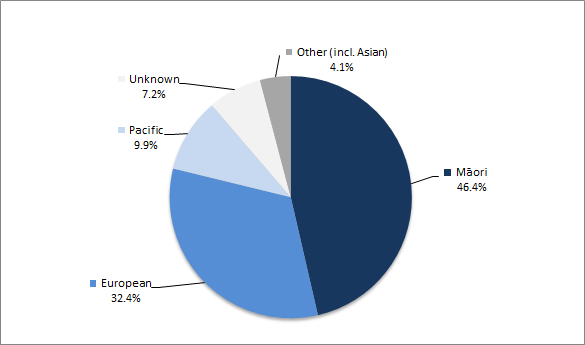
Community-based offenders by ethnicity
Community-based offenders by gender
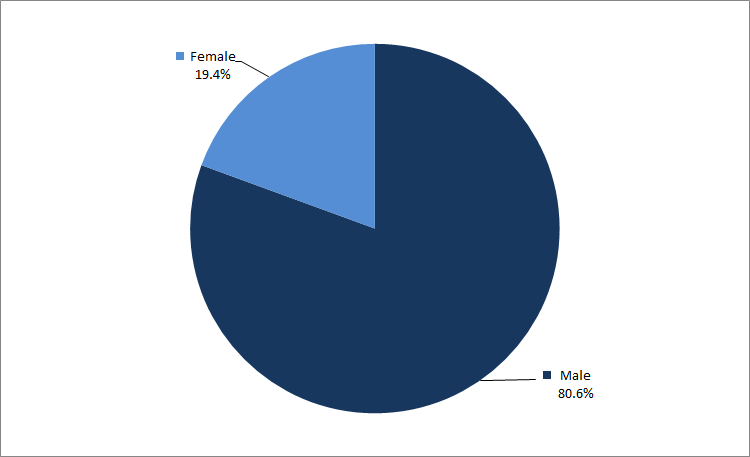
Community-based offenders by offence type*
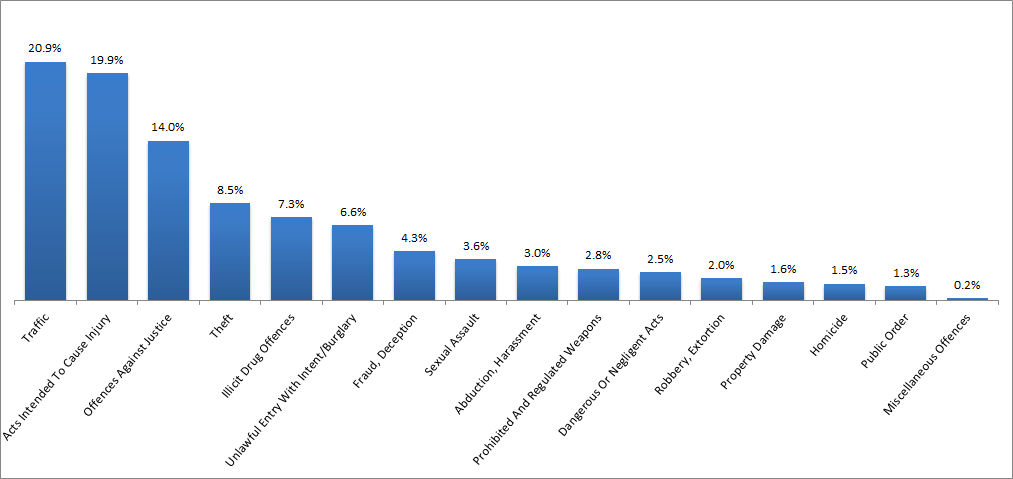
* Community-based offenders may be convicted of offences across multiple categories. This information is based on the most serious offence an offender is convicted of.
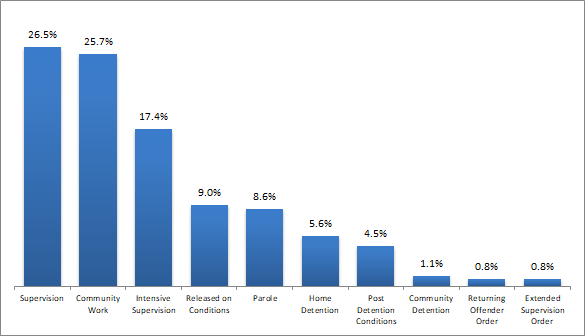
Community-based sentences and orders by type
