Community sentences and orders statistics - December 2009
This page shows statistical information on the:
- Number of offenders serving community sentences and orders around the country
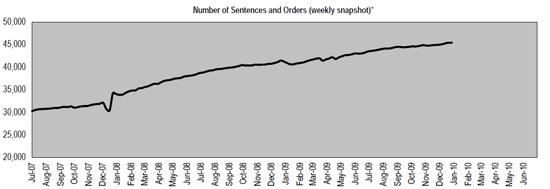
- Total number of sentences and orders being served
- The percentage of different types of sentences and orders
- Breakdown of the offender population by
- Other facts and figures
* Refers to the total number of sentences and orders being served. An individual offender can be serving more than one sentence and/or order at any time.
Total number of sentences and orders* (weekly snapshot)
View a larger version of the total community sentences and orders graph
* Refers to the total number of sentences and orders being served. An individual offender can be serving more than one sentence and/or order at any time.
Proportion of different sentences and orders*
(as at December 2009)
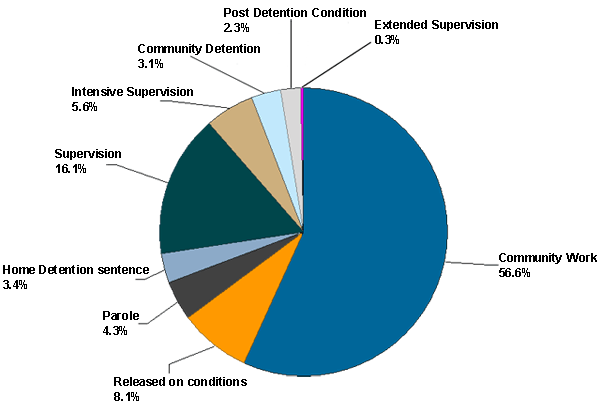
* Refers to the total number of sentences and orders being served. An individual offender can be serving more than one sentence and/or order at any time.
Percentage of offenders serving community sentences and orders in different age groups
(as at December 2009)
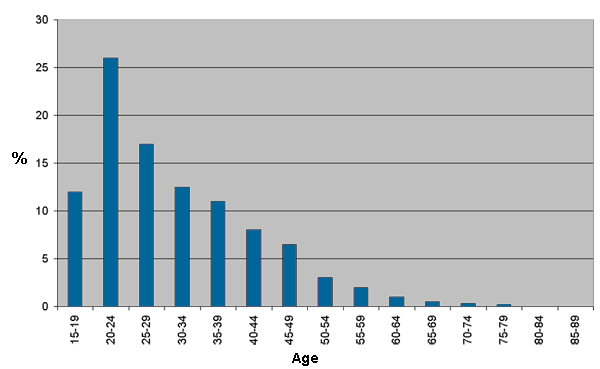
* This graph relates to the number of individual offenders serving sentences or orders in the community. An offender can be serving more than one sentence and/or order at any time.
Percentage of offenders serving community sentences and orders according to most serious* offence type
(as at December 2009)
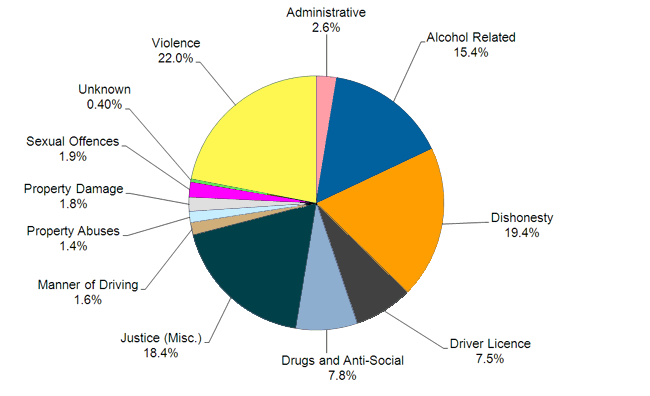
* Offenders may be convicted of offences across multiple categories. This information is based on the most serious offence a prisoner is convicted of.
Gender of offenders serving community sentences and orders
(as at December 2009)
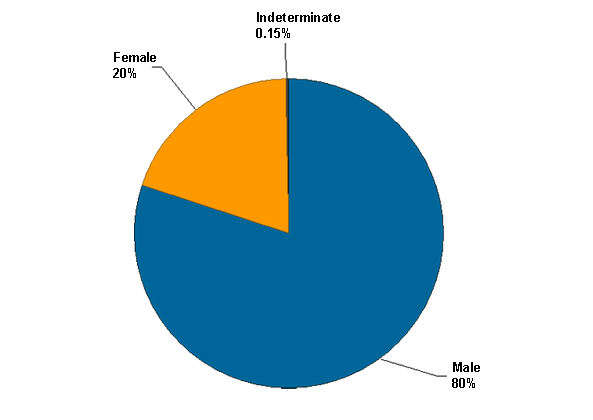
* This graph relates to the number of individual offenders serving sentences or orders in the community. An offender can be serving more than one sentence and/or order at any time.
Ethnicity of offenders seving community sentences and orders
(as at December 2009)
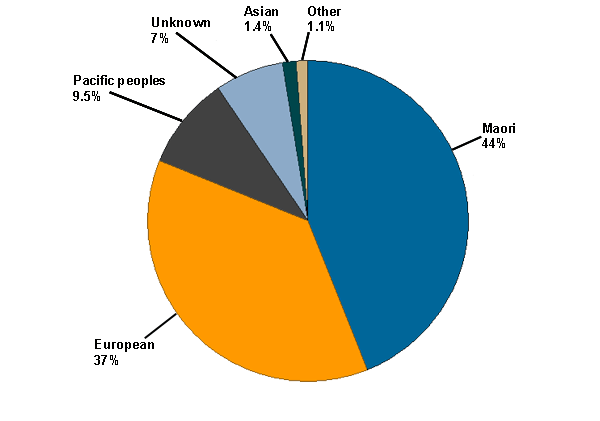
* This graph relates to the number of individual offenders serving sentences or orders in the community. An offender can be serving more than one sentence and/or order at any time.
Other facts and figures
- The average number of offenders on community sentences and orders being managed on any given day was 44,893 at the end of March 2010.
- The average cost per offender on a community-based sentence or order was $9.92 per day or $3621 per year in the 2008/09 financial year.
- Offenders serving Community Work sentences completed 3,285,373 hours of work in the 2008/09 financial year.
- Corrections provided 44,596 pre-sentence reports to the judiciary in the 2008/09 financial year.
- 46 per cent of those who serve a community-based sentence or order are not convicted of another crime within four years.
- 36 per cent are convicted of a crime and receive another community sentence within four years.
- 18 per cent are convicted of a crime and sent to prison within four years.
* The reconviction rates above are from a 2008 report: Reconviction patterns of offenders managed in the community


