11.3 Offender timelines
The previous section described the reduction of the source data into a single timeline of distinct non overlapping periods of management for each offender. A graphical representation of an example timeline was then given. Using this graphical representation it now becomes possible to graphically describe the complex cross section of offenders that Corrections deals with on a daily basis and what we have been directed to do to them.
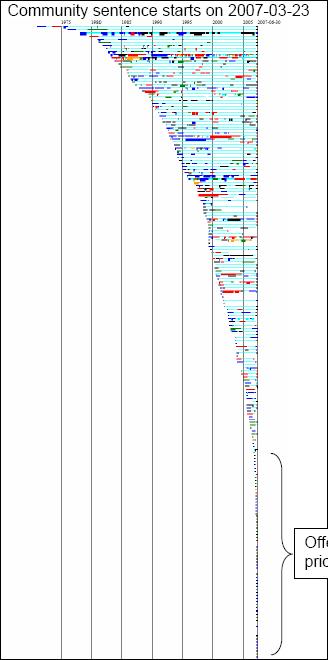
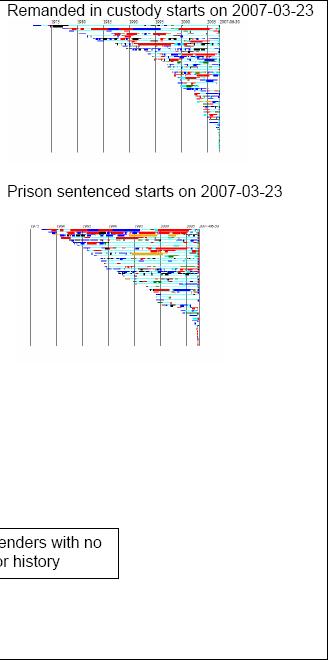
The groups of timelines below describe the groups of offenders starting episodes of Corrections management on a typical day (one line per offender).
In the picture above one can see the proportion of offenders that typically start community sentences with no prior Corrections history. The picture also indicates (by the amount of colour) that many community sentenced offenders arrive with prior Corrections history and many prison sentenced offenders arrive with even more colourful histories.
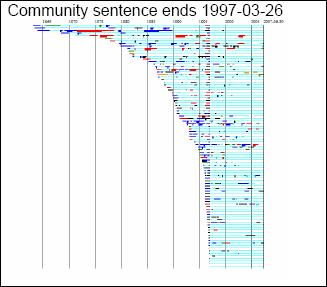
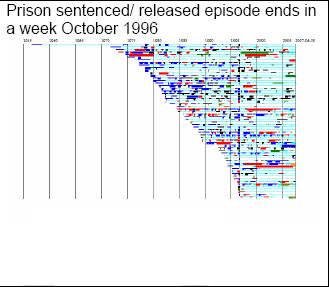
Typical timelines of offenders completing sanctions 10 years ago


