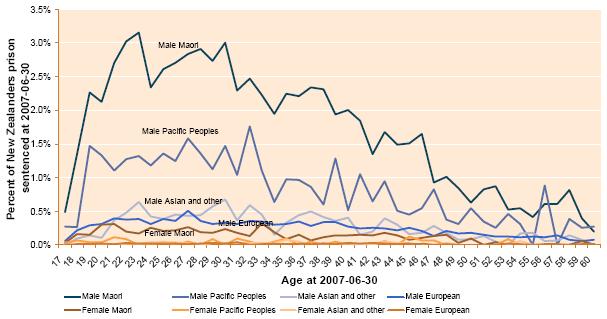
2.12 Imprisonment rates at 2007-06-30 by gender-ethnicity-age
For more details see: data source and enrichment methodology; data spreadsheet ; multiple ethnicity.
The graph above gives a rate of imprisonment by the same gender-age-ethnicity sub-groupings in the previous graphs. Most notably, this reveals that 3.2% of all Maori males in the 23 year old age group were in prison on 30 June 2007, while the proportion of NZ European 23 year old males in prison was 0.4%.


