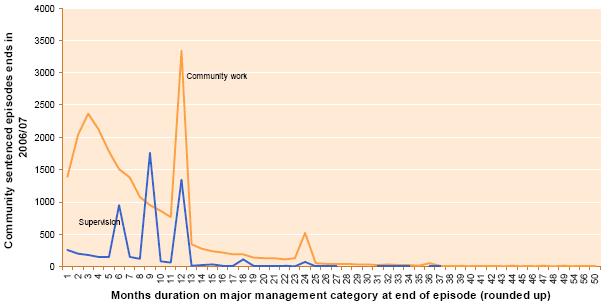
8.8 Community sentenced ends in 2006/07 by management category and duration
For more details see: data source and enrichment methodology; data spreadsheet.
The graph above shows the distribution of time spent on each type of community sentence episode measured at the time the community sentence episode ended. The noticeable spikes at six, nine and twelve months relate to the large number of community sentences given with these standard timeframes and which did not get terminated due to earlier completion of hours or requirements, or were overtaken by other events.


