Outcomes - Achievements in 2005/2006
Protecting the Public
The departmental outcome of 'protecting the public' is primarily attained by the strategies and initiatives outlined in Theme 1 of the Strategic Business Plan. Progress towards the achievement of the outcome is measured through analysis of data collected across a range of quality and effectiveness measures designed to ensure offenders are being managed in a safe, secure and humane manner. These include measuring and monitoring:
- compliance with, and the administration of, sentences and orders
- the number of escapes that occur from prisons and while under escort or supervision
- the number and severity of incidents, including deaths in custody.
A number of these measures are included in the Statement of Service Performance objectives for output classes 2 to 5 in Part Four of this Annual Report. Other measures are included in the Department's performance management framework or provided from internationally benchmarked data.
International Benchmarks
As stated in the Managing for Outcomes section in Part One of this Annual Report, the Department has developed close working relationships, and participates in the exchange of information with a number of overseas jurisdictions, such as Australia, Canada, England and Wales, and Scotland. The information exchanged has been used to develop benchmarks comparing performance across a range of indicators, including prisoner-to-staff ratios, costs of securing prisoners and occupancy statistics. This data is important because the Department is not able to compare performance in its core offender management functions against other New Zealand organisations.
In making these comparisons, the Department assesses the comparability of the data in question. Where the jurisdictions have similar business operations, definitions and counting rules, there is high comparability, allowing benchmarking with no adjustments. Where the jurisdictions have similar business operations, but minor inconsistencies in definitions and counting rules, there is medium comparability, providing a reasonable benchmark comparison, although one that may require small adjustments to data and counting. Where the jurisdictions again have similar operations but different definitions and counting rules, adjustments would be required before true benchmark comparisons could be made, and therefore comparability is low. Such adjustments have not been made to the data reported in this Annual Report.
The Department's use of international benchmarking continues to develop. The data available still stands largely alone and further analysis is required before informed comparison may be made between New Zealand and its benchmark jurisdictions. Full comparisons need to take account of a range of variables. For example, Scotland, with lower costs than New Zealand, also has lower prisoner/staff ratios, a higher occupancy rate and higher assault rates, but lower death rates and lower rates of escapes while positive drug tests are at similar levels. From this, it is not yet possible to draw firm conclusions about the relative performance of the New Zealand and Scottish prison systems. Some observations, however, are made in the commentary accompanying the tables on the following pages.
The tables on the following pages illustrate the significant progress that has been made in recent years towards improving the Department's performance in a number of key areas. The information is also presented (where relevant) in comparison with the Department's international benchmark jurisdictions.
Cost per Prisoner per Day
FIGURE 1: Cost Per Prisoner Per Day
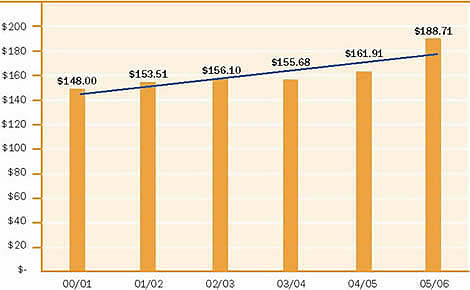
One component in determining the performance of the corrections system is an assessment of the basis of the costs of accommodating a prisoner.
The cost per prisoner per day has increased from $161.91 in 2004/05 to $188.71 in 2005/06. The major reason for the increase was the "cost of capital" in 2005/06 for new facilities that are under construction or not yet operating at full capacity. If this factor was to be excluded, the cost per prisoner per day would have increased to $167.30 in 2005/06 primarily due to increased operational costs of meeting higher than forecast prisoner numbers.
FIGURE 2: Cost Per Prisoner Per Day International Comparison
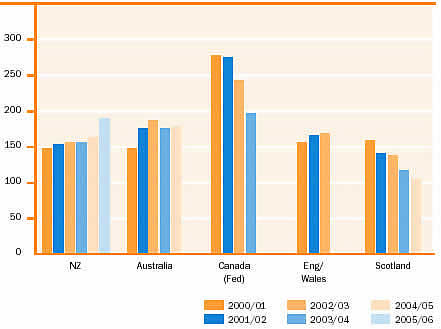
International comparisons of costs between jurisdictions are based on the average daily cost per prisoner using the Economist Annual Comparison Index. Despite a trend for increasing costs for New Zealand prisons (largely driven by increased capital investment), New Zealand ranks in the mid-range of the benchmarked jurisdictions.
Comparable figures for the 2003/04 and 2004/05 financial years for England and Wales are not available due to the public prison service being transferred to operate under the National Offender Management Service (NOMS) in June 2004. Previously the prison service operated under Correctional Services as part of the UK Home Office, which included costs associated with private prisons.
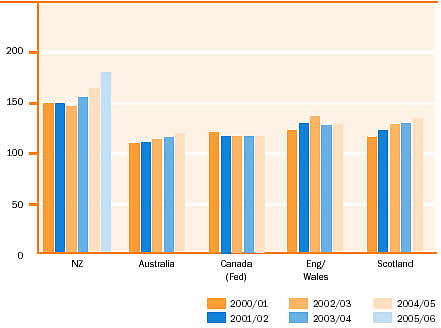
Prisoner/Frontline Staff Ratio
The ratio of prisoners to full-time equivalent (FTE) frontline staff identifies the number of prisoners for each staff member and thus highlights the level of staff supervision available. Figure 3 compares the ratio of the average number of prisoners per annum to FTE frontline staff at the reporting date, across jurisdictions.
FIGURE 3: Prisoner/Frontline Staff Ratio
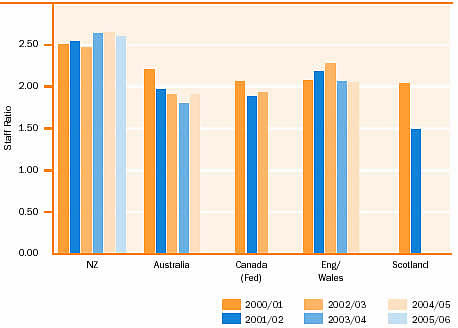
NB: Data not available for Canada 2003/04 and 2004/05 or Scotland 2002/03, 2003/04 and 2004/05.
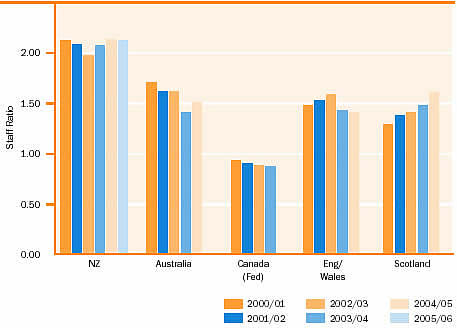
Prisoner/Total Staff Ratio
New Zealand's ratio of prisoners to total staff exceeds that of the other international jurisdictions. In New Zealand there has been an average of two prisoners to one staff member over the period from 2000/01 to 2005/06. NB: Data not available for Canada 2004/05.FIGURE 4: Prinsoner/Total Staff Ratio
Occupancy
Occupancy is based on the average number of available (permanent) prison beds and the average prison population for the year.
The optimum rate of prison utilisation is between 85 and 95 percent, which allows facilities to accommodate the transfer of prisoners, provide for special purpose accommodation (for example, protection units), provide separate facilities for males and females and for different security levels, and facilitates the management of short-term fluctuations in prisoner numbers. New Zealand's occupancy rate will fluctuate over time, as new prison facilities are developed to cater for the increases in prisoner numbers. Average occupancy for the 2005/06 year was 97.7 percent. Of the jurisdictions that provided data in 2004/05, none fell within the preferred range of 85 to 95 percent of design capacity for total prisoners. The comparability of the New Zealand data with the other jurisdictions is assessed as being medium to low.
NB: Data not available for Canada 2000/01, 2001/02, 2003/04 and 2004/05 or Scotland 2002/03, 2003/04 and 2004/05 or England/ Wales 2004/05. Further efforts will be made to obtain information for international jurisdictions over the next financial year; if information continues to be unavailable the jurisdiction will be removed from future reports.
FIGURE 5: Occupancy - New Zealand

FIGURE 6: Occupancy - International Comparison
Quality Indicators
Quality indicators measure prison management and the health and safe containment of prisoners. This includes the provision of interventions that address the causes of offending and support successful reintegration into the community.
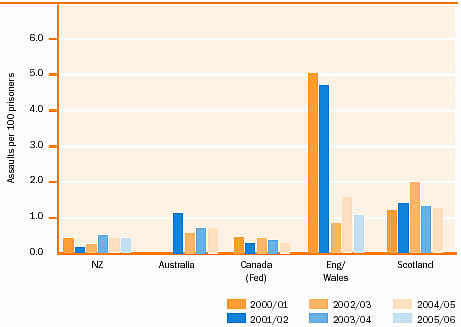
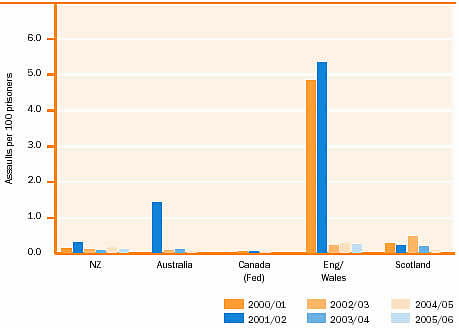
Prisoner/Prisoner Assault (Serious) A serious assault is defined as one where the victim requires overnight hospitalisation or ongoing medical intervention. Figures 7 and 8 show the number of serious prisoner/prisoner assaults per 100 prisoners. There was a decline in the number of serious assaults reported in New Zealand prisons during the financial years 2001/02 and 2002/03. That trend has changed slightly since 2003, but the results are still well below the rates reported during 1997/98. The rate of 0.40 for 2005/06 represents a total of 30 serious assaults by prisoners on prisoners, and a slight increase on the result for the 2004/05 financial year. This represents a very favourable result despite the considerable operational pressures from the continuing high prison population levels.Internationally, in 2004/05, New Zealand had a rate of serious assaults significantly lower than Scotland, Australia and England/Wales. However, the comparability of the New Zealand data is low with Australia and is not directly comparable with the other jurisdictions because of different counting rules.
NB: Data not available for Australia 2000/01.
FIGURE 7: Prisoner/Prisoner Assault (Serious)
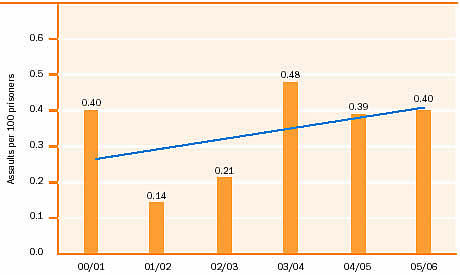
FIGURE 8: Prisoner/Prisoner Assault (Serious) International Comparison
There were seven serious assaults on staff in 2005/06 compared with nine in 2004/05, and the overall trend continues to be downward. This represents a very favourable result despite the considerable operational pressures from the continuing high prison population levels.
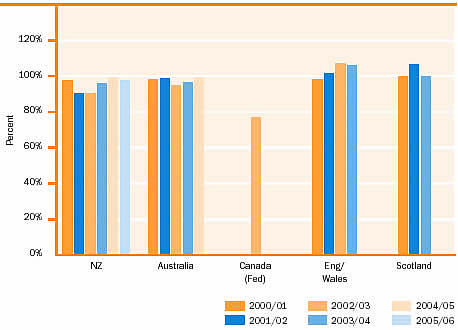
New Zealand's low rate of serious prisoner/staff assaults is consistent with the other jurisdictions. England/ Wales has not provided data for 2003/04, however, its serious assault rate reduced dramatically in the 2002/03 year. It is not apparent whether this is a result of improved prisoner management regimes or reporting/definitional issues. The comparability of this data is assessed as low.
NB: Canada's reported rate for 2002/03 and 2003/04 was nil.
FIGURE 9: Prisoner/Staff Assaults (Serious)
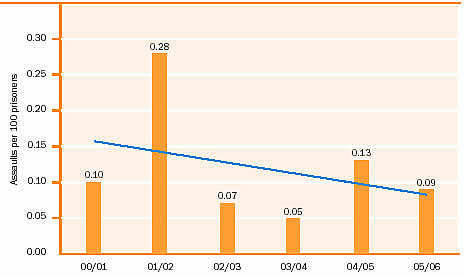
FIGURE 10: Prisoner/Staff Assaults (Serious) International Comparison
Deaths in Custody
The corrections system has to deal with a high proportion of people with a propensity to self-harm in prison. Deaths in custody are regrettable and are a serious matter subject to independent investigation.
Unnatural Deaths in Custody
Unnatural deaths include suicides, homicides, deaths by drug overdose and deaths by accident. The majority of unnatural deaths in prisons are suicides.
Recent trends in this area in the New Zealand corrections system remain positive. In 2005/06, there were eight unnatural deaths in prison (0.11 per 100 prisoners) 2004/05, which represents two more deaths than in the 2004/05 financial year.
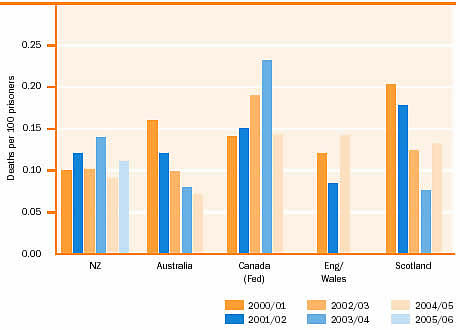
The rate of unnatural deaths in New Zealand remains below that of Canada, however, it has increased above that of Australia. England/Wales have not supplied data on this measure for the 20002/03 and 2004/05 financial years. The comparability of the New Zealand data is high with all the other jurisdictions.
NB: Data not available for England/ Wales 2002/03 and 2003/04.
FIGURE 11: Unnatural Deaths in Custody
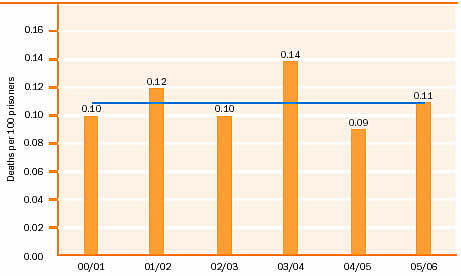
FIGURE 12: Unnatural Deaths in Custody - International Comparison
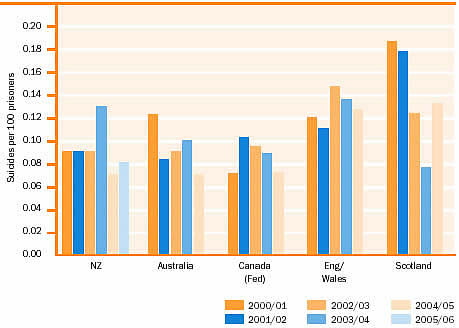
Suicides in Custody
Prisoner suicide reduction continues to be a key priority for the Department. Figure 13 reports the trend in the number of suicides per 100 prisoners.There were six suicides (0.08 per 100 prisoners) in 2005/06, two remand prisoners and four sentenced prisoners, one more than in the 2004/05 financial year.New Zealand's suicide rate has historically been lower than its international benchmark jurisdictions, apart from Canada, where prisoners sentenced to less than two years are not included in the federal statistics.
FIGURE 13: Suicides in Custody
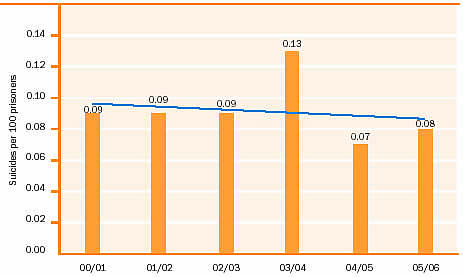
FIGURE 14: Suicides in Custody - International Comparison
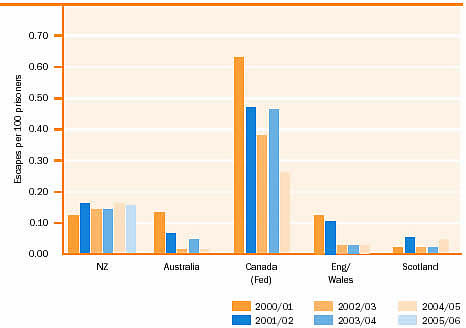
Escapes from Prison
The total number of prisoner escapes in New Zealand against all security classifications in 2005/06 was 20, compared with 19 in 2004/05.
Figure 15 shows the trend in breakout escapes per 100 prisoners. A breakout escape is one where a prisoner has breached security measures and has physically left the area contained by the outermost perimeter security fence, or, if there is no such fence, prison buildings, police cell, court complex or other place of custodial control.
Of the 20 escapes in 2005/06, there was a total of 11 breakout escapes – the same number as in 2004/05 – although the average prison population has increased by 9.3 percent.
The comparability of New Zealand data on breakout escapes (Figure 16) is medium with Canada and Scotland, but low with Australia and England/Wales. Canadian data excludes prisoners serving sentences of less than two years, who are not accommodated in federal prisons.
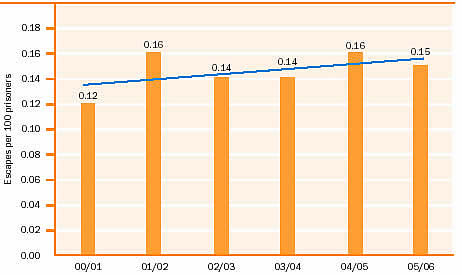
FIGURE 16: Breakout Escapes - International Comparison
Drug and Alcohol Use by Offenders
In November 2004, the Department introduced its Strategy to Reduce Drug and Alcohol Use by Offenders 2005-2008. This strategy, the third to be released since 1998, builds on the progress achieved under the previous two strategies and outlines directions and initiatives for the 2005–2008 periods and beyond. The primary point of difference from previous strategies is that the current strategy extends its focus, as much as practicable, beyond prisons to offenders serving community-based sentences.
The strategy also has an increased focus on what works to reduce drug and alcohol use by M?ori offenders. A number of projects, outside the specific scope of the strategy, are being undertaken to improve the involvement of wh?nau, hapu, iwi and M?ori providers in the Department's work with offenders, but which will be relevant to future directions in reducing M?ori offender drug use and re-offending. These projects include investigating the development of programmes for wh?nau that sit within or parallel to offender programmes, and reviewing rehabilitation programmes (such as the 100-hour substance abuse programme) with the view to increasing wh?nau involvement.
The strategy recognises that a large proportion of prisoners have drug and alcohol problems. These problems are often a significant factor in their offending behaviours. Drug use in prison perpetuates the dependency problems and the illegal lifestyles of prisoners. It also creates problems for their relatives and friends (such as the pressure to supply drugs) and for prison staff in the management and rehabilitation of prisoners.
The Department's drug strategy is designed around three key objectives:
- enhancing efforts to reduce the supply of drugs to offenders
-
strengthening efforts to reduce offenders' demand for drugs
- increasing attention on reducing the harm caused by drugs.
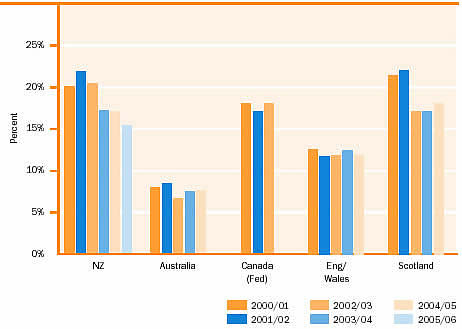
FIGURE 17: General Random Drug Tests - International Comparison
The strategy is supported by drug testing of prisoners and strict detection procedures. Drug detection dogs are regularly used at visitor checkpoints, and for random searches of prison buildings and land. Anyone found bringing drugs into a prison is banned from visiting the prison.
The total of positive results from general random drug tests for the year ended 30 June 2006 was 15 percent, compared with 17 percent for the previous year. Full results of drug tests are reported on page 122. Of the total positive results to general random drug tests in 2005/06, 88 percent were positive for cannabinoids, with the remaining 12 percent positive for other drugs.
The comparability of drug-testing results between jurisdictions is regarded as low. Although drug-testing practice is similar, there are differences between jurisdictions in the percentages of prisoners randomly tested, the treatment of refusals and the length of time prisoners must serve before being available for random testing.
Imprisonment Rate
The imprisonment rate identifies the number of people imprisoned per 100,000 of the national population. This is an indication of the extent to which prison is used as a sentencing option by the judiciary.
New Zealand has had the highest imprisonment rate of the five jurisdictions since 2000/01 and has continued to increase to a 2005/06 rate of 180 prisoners per 100,000 of national population. England/Wales, Scotland and Australia show marginal increases. The Canadian data excludes those prisoners serving sentences of less than two years who are accommodated in federal institutions.
FIGURE 18: Imprisonment rate - International Comparison
Reducing Re-offending
Progress towards the achievement of the departmental outcome of 'reducing re-offending' is assessed through the use of two measures, the Recidivism Index (RI) and the Rehabilitation Quotient (RQ). The RI measures the Department's performance in reducing re-offending as a whole, whereas the RQ measures the ability of a specific intervention to reduce re-offending. These indicators provide one means for assessing the Department's performance. It should be noted, however, that the use of reconviction data as indicators of performance is not straightforward: re-offending, reconviction and sentencing are subject to a range of influences, many of which are outside the Department's direct control.
A full explanation for the RI and RQ methodologies can be found on pages 36 - 42 of the Department's 2004/05 Annual Report (see related links in top right corner of this page)
Analysis of reported RI figures
Table 4 provides reconviction rates as recorded over 12 months, for those released from prison, or commencing community-based sentences, during the 2004/05 (1 April – 31 March) year, and Table 5 provides the rates over 24 months for those released from prison, or commencing community-based sentences, during the 2003/04 year. RI figures are reported for multiple categories of offenders, with significant variation observed in reconviction rates between sentence types, offence types and demographic groups.
The overall RI results for 2005/06, when compared to the 2004/05 reported results, indicate small percentage decreases in average reconvictions and re-imprisonments for all offenders released from prison. For offenders commencing community-based sentences, there was a small decrease in reconviction rates and a very small increase in imprisonments.
RI Sub-group Comparisons
When examined by the sub-groupings for which RIs are calculated, notable features for those released from a custodial sentence (12-month follow-up) include the following:
- Males are re-imprisoned at a significantly higher rate than females (29% and 18% respectively) and reconviction rates for male offenders released from prison are also higher than for female offenders (42% and 32% respectively).
- The re-imprisonment and reconviction rates for Pacific peoples (21% and 32% respectively) were notably lower than those for M?aori (30% and 45%) and Europeans (27% and 39%).
- Re-imprisonment rates reduce by approximately two-thirds as offenders age (offenders over 40 years are re-imprisoned at less than one-third the rate of those under 20), and vary markedly between offence classes (dishonesty offenders having the highest rates and sex offenders the lowest).
- Offenders released on home detention had reconviction and re-imprisonment rates substantially lower than the average. This difference was particularly marked for those released from prison to “back end” home detention, with the re-imprisonment rate (12%) being lower than almost every other sub-group of released prisoners.
- Prisoners granted early release on parole were re-convicted at rates lower than those subject to other types of release (other than home detention). Comparisons with the previous years' 12-month RI figures for parole releases reveal a continuing decline in reconvictions amongst this group.
- Re-imprisonment rates were higher for prisoners released from medium security classification (38% to 58%) than those for prisoners released from minimum security classification (24%).
- There is a tendency for shorter sentence length to be associatedwith higher rates of re-imprisonment and reconviction. Offenders serving sentences of between one and two years are re-imprisoned at a higher rate than offenders with a sentence length between three and five years (32% and 18% respectively). It is likely that older age (which bears a strong inverse relationship to risk) is linked to lower recidivism amongst longer-sentenced prisoners.
Offenders serving community-based sentences had significantly lower imprisonment and reconviction rates than offenders released from prison. In general, most of the trends noted for released prisoners above were evident for this population also.
Of interest is the fact that 'front-end' home detention is typically applied to those whose risk of re-offending is higher than other offenders serving community-based sentences. Nevertheless, these home detainees recorded a rate of reconviction lower than the rate for those sentenced to Community Work, and almost half that of those serving supervision orders. The current reconviction and re-imprisonment rates for 'front-end' home detainees are lower than the corresponding figures reported in 2004/05. In the case of 'front-end' reconvictions, the reduction is 2.5 percent.
For both prison releases and community sentence offenders, the 24-month RIs generally show a predictable pattern, in that the 24-month RI figures typically increase by between 35 percent and 50 percent over the 12-month rates. This year RI figures were also calculated at the 36-month follow-up point for offenders released from prison, or commencing community sentences in 2002/03. This revealed 10 – 20% increases in re-imprisonment and reconviction over the 24-month figures.
These data are consistent with a great deal of research on recidivism which indicates that the highest rate of reconviction occurs within the first twelve months, with the proportion re-convicted in each successive year progressively smaller than in the previous year.
TABLE 4: Recidivism Index - 12 Months Follow-up (percentages) for 2004/05
|
Category |
Group | Released from prison | Beginning community sentence | ||
|---|---|---|---|---|---|
| Reimprisoned | Reconvicted | Imprisoned | Reconvicted | ||
|
All |
27.7 |
41.1 |
8.2 |
28.7 |
|
|
Gender |
Female |
17.8 |
31.8 |
3.8 |
19.0 |
| Male |
28.6 |
42.0 |
9.3 |
31.1 |
|
|
Ethnicity |
European |
27.0 |
39.2 |
7.0 |
27.2 |
|
M?ori |
29.9 |
44.9 |
10.0 |
32.2 |
|
|
Pacific |
20.5 |
31.9 |
5.8 |
21.3 |
|
|
Other (incl. Asian) |
6.7 |
11.1 |
4.0 |
16.4 |
|
|
Age (at PPS release or start of CPS sentence) |
20 years |
46.0 |
65.0 |
11.5 |
45.4 |
|
20-24 years |
34.5 |
51.0 |
9.4 |
31.3 |
|
|
25-29 years |
29.7 |
44.3 |
8.6 |
28.3 |
|
|
30-39 years |
24.0 |
36.8 |
7.4 |
23.9 |
|
|
40 and above |
15.1 |
22.6 |
4.1 |
15.3 |
|
| Offence (most serious for original sentence) |
Dishonesty |
43.8 |
59.8 |
12.4 |
40.4 |
|
Property Damage/Abuses |
27.9 |
44.9 |
10.5 |
35.9 |
|
|
Admin |
30.8 |
43.6 |
8.7 |
20.6 |
|
|
Violence |
26.3 |
40.3 |
7.4 |
28.4 |
|
|
Traffic |
18.3 |
29.9 |
6.0 |
22.9 |
|
|
Drug & Anti-social |
17.0 |
27.5 |
6.9 |
26.4 |
|
|
Sexual |
8.7 |
13.3 |
4.2 |
14.2 |
|
|
Other Minor offences* |
(see note ) |
(see note ) |
6.1 |
22.5 |
|
| Community-Based Sentence |
Supervision |
n/a |
n/a |
12.0 |
30.8 |
|
Periodic Detention** |
n/a |
n/a |
n/a |
n/a |
|
|
Community Work** |
n/a |
n/a |
7.6 |
29.1 |
|
|
Community Service |
n/a |
n/a |
n/a |
n/a |
|
| Prisoner Security Classification (at release) |
Maximum* |
(see note ) |
(see note ) |
n/a |
n/a |
|
High-medium |
57.6 |
67.0 |
n/a |
n/a |
|
|
Low-medium |
38.2 |
52.3 |
n/a |
n/a |
|
|
Minimum |
24.0 |
37.1 |
n/a |
n/a |
|
| Release Type | Parole |
22.6 |
30.4 |
n/a |
n/a |
| Home Detention*** |
12.1 |
19.0 |
6.2 |
14.9 |
|
| Post Release Conditions**** |
30.0 |
44.2 |
n/a |
n/a |
|
| Sentence Length | 6 mth or less |
27.1 |
42.4 |
7.6 |
28.6 |
| 6mth but <=1yr |
30.2 |
43.6 |
12.0 |
29.4 |
|
|
1 to 2 yr |
31.6 |
45.1 |
14.6 |
28.3 |
|
| 2 to 3 yr |
24.7 |
35.2 |
n/a |
n/a |
|
| 3 to 5 yr |
18.3 |
25.9 |
n/a |
n/a |
|
| 5 yr |
19.9 |
23.8 |
n/a |
n/a |
|
| All (2003/2004) |
|
28.9 |
42.6 |
8.0 |
29.2 |
Figures indicate rate of reconviction/re-imprisonment (within a subsequent 12-month period) amongst all offenders released from prison or commencing a new community sentence between 1 April 2004 and 31 March 2005.
Source is CMS conviction and sentencing data as at 30 June 2006.
- * Insufficient numbers to report.
- ** The Sentencing Act 2002 abolished Periodic Detention and replaced it with Community Work on 1 July 2002.
- *** 'Front-end' home detention reported as CPS new start; 'back-end' home detention reported as PPS release.
- **** Post-release conditions was introduced by the Sentencing Act 2002; order imposed by judge at time of sentencing.
TABLE 5: Recidivism Index - 24 Months Follow-up (percentages) for 2004/05
|
Category |
Group | Released from prison | Beginning community sentence | ||
|---|---|---|---|---|---|
| Reimprisoned | Reconvicted | Imprisoned | Reconvicted | ||
|
All |
39.2 |
56.4 |
12.1 |
40.4 |
|
|
Gender |
Female |
25.2 |
47.8 |
5.8 |
26.8 |
| Male |
40.5 |
57.2 |
13.7 |
43.9 |
|
|
Ethnicity |
European |
36.4 |
52.3 |
10.3 |
36.9 |
|
M?ori |
43.3 |
61.9 |
14.6 |
45.9 |
|
|
Pacific |
27.6 |
43.0 |
9.4 |
33.2 |
|
|
Other (incl. Asian) |
20.9 |
29.1 |
8.0 |
24.2 |
|
|
Age (at PPS release or start of CPS sentence) |
20 years |
60.5 |
82.4 |
15.1 |
57.6 |
|
20-24 years |
46.3 |
66.4 |
13.9 |
46.9 |
|
|
25-29 years |
42.9 |
62.1 |
13.3 |
42.6 |
|
|
30-39 years |
37.0 |
53.8 |
12.0 |
35.9 |
|
|
40 and above |
22.0 |
33.0 |
8.0 |
23.9 |
|
| Offence (most serious for original sentence) |
Dishonesty |
55.0 |
74.0 |
16.8 |
52.0 |
|
Property Damage/Abuses |
49.4 |
60.4 |
13.6 |
46.7 |
|
|
Admin |
40.6 |
59.4 |
11.7 |
32.4 |
|
|
Violence |
37.1 |
54.9 |
12.4 |
41.7 |
|
|
Traffic |
32.2 |
50.8 |
9.7 |
33.9 |
|
|
Drug & Anti-social |
24.5 |
39.1 |
10.8 |
35.2 |
|
|
Sexual |
15.8 |
25.1 |
8.3 |
27.7 |
|
|
Other Minor offences* |
(see note ) |
(see note ) |
8.3 |
35.8 |
|
| Community-Based Sentence |
Supervision |
n/a |
n/a |
18.6 |
45.7 |
|
Periodic Detention** |
n/a |
n/a |
n/a |
n/a |
|
|
Community Work** |
n/a |
n/a |
10.9 |
40.3 |
|
|
Community Service |
n/a |
n/a |
n/a |
n/a |
|
| Prisoner Security Classification (at release) |
Maximum* |
(see note ) |
(see note ) |
n/a |
n/a |
|
High-medium |
55.4 |
66.9 |
n/a |
n/a |
|
|
Low-medium |
51.4 |
66.5 |
n/a |
n/a |
|
|
Minimum |
34.9 |
53.1 |
n/a |
n/a |
|
| Release Type | Parole |
32.3 |
43.8 |
n/a |
n/a |
| Home Detention*** |
16.2 |
25.4 |
6.2 |
14.9 |
|
| Post Release Conditions**** |
42.7 |
61.7 |
n/a |
n/a |
|
| Sentence Length | 6 mth or less |
38.8 |
57.0 |
11.2 |
39.7 |
| 6mth but <=1yr |
42.9 |
61.5 |
19.4 |
45.7 |
|
|
1 to 2 yr |
43.6 |
62.6 |
19.1 |
45.4 |
|
| 2 to 3 yr |
34.2 |
46.6 |
n/a |
n/a |
|
| 3 to 5 yr |
25.5 |
40.4 |
n/a |
n/a |
|
| 5 yr |
29.5 |
40.6 |
n/a |
n/a |
|
| All (2003/2004) |
|
37.2 |
55.4 |
11.7 |
40.2 |
Figures indicate rate of reconviction/re-imprisonment (within a subsequent 24-month period) amongst all offenders released from prison or commencing a new community sentence between 1 April 2003 and 31 March 2004.Source is CMS conviction and sentencing data as at 30 June 2006.
Rehabilitation Quotient
The Department delivers a range of rehabilitative and reintegrative interventions designed to enable offenders to lead law-abiding lives. These programmes have been designed and implemented in ways consistent with internationally developed best practice principles.
Research on outcomes from rehabilitative programmes has shown that significant reductions in reconviction and re-imprisonment can be achieved when this form of intervention is effectively delivered to appropriately selected offenders.
The purpose of the Rehabilitation Quotient is to gauge the extent to which re-offending is reduced amongst those who received a rehabilitative intervention. As noted above, a full explanation of the RQ methodology is available on pages 36-42 of the 2004/05 Annual Report.
The 2004/05 Annual Report contained extensive discussion on findings of poor outcomes from some of the Department's programmes. As a consequence of these findings, the Department moved swiftly to review the entire rehabilitative programme framework, including principles for eligibility and selection of offenders. This work resulted in the termination of certain poorly performing programmes (the cognitive skills course “Straight Thinking”), and extensive work to redevelop others (eg, the lower-intensity 100-hour programmes).
Rehabilitation data analysed this year was derived from programmes which were completed between 1 April 2004 and 31 March 2005. Therefore, a significant amount of the data relates to programmes that have since either been discontinued or re-designed.
Unsurprisingly, similar outcomes to those given in the 2004/05 Annual Report were found once more in relation to the lower intensity programmes: an absence of positive treatment effect. Obviously, the replication of this finding confirms the direction taken by the Department in re-designing its core rehabilitative programmes.
On the other hand, again replicating last year's results, positive results were recorded in relation to the more intensive programmes, the prison-based drug and alcohol treatment units (DTUs), and the sex offender special treatment units (STUs).
These overall results support the conclusion that more intensive programmes, delivered by specialist personnel to offenders at higher risk of re-offending, are effective in reducing rates of re-offending. The Department is currently moving to expand its suite of higher-intensity programmes, including the drug treatment units and special treatment units, largely on the basis of these recorded outcomes.
A caveat on the interpretation of these results is that offenders managed by the Department have access to a wide range of services, including educational, employment and general living skills training, as well as various supports to assist with reintegration to the community. These services are available in varying degrees to offenders irrespective of whether they have also participated in the core rehabilitative interventions (the impact of which the RQ attempts to measure). At this stage the RQ methodology does not ascertain the nature and quality of these services as accessed by individuals, and does not take into account the relative contribution that each of these services may be making to final recidivism outcomes. However, it is widely accepted that the provision of education, training and reintegrative support services can have a significant impact on re-offending.
|
Intervention Type |
12-months follow-up | 24-months follow-up | ||
|---|---|---|---|---|
| Reconvicted | (Re-) Imprisoned |
Reconvicted |
(Re-) Imprisoned | |
|
Special Treatment Units (sex offending) |
0.08 | 0.06 | 0.05 | 0.07 |
|
Special Treatment Units (alcohol & drugs) |
0.05 | 0.09 | 0.05 | 0.13 |
Note 1: Figures represent percentage-point differences between recidivism rates for treatment and control groups. Positive scores indicate a reduction in reconviction/re-imprisonment for treated offenders (eg, 0.10 indicates that the rate of reconviction/re-imprisonment among treated offenders was 10 percentage points lower than the rate for untreated offenders).
Research and Evaluation
Research and evaluation projects, including some multiyear projects, underway during 2005/06 included:
- Examination of the rehabilitative treatment needs and appropriate treatment design for high-risk offenders, and sexual offenders against women.
- Analysis of the characteristics of violent offenders, and their rehabilitative needs.
- An evaluation of the learning outcomes from a range of courses made available to prisoners to support reintegration to life with the community.
- Reviewing the effectiveness of the prison Drug Treatment Units.
- Evaluation of the utility for sentence management of the M?ori culture-related needs (MaCRN) assessment.
- Research into the outcomes experienced by prisoners who have participated in Corrections Inmate Employment work training.