Financial Overview
The following pages provide an overview of our financial performance for the year ended 30 June 2015.
Overall results
Corrections spent $1.2 billion excluding remeasurements, which was $4.6 million below the supplementary estimates.
The underspend was mostly the result of:
- decreasing our discretionary spend in areas such as staff travel, training, contractor and consultants and contracted services
- lower than expected change costs.
Pre-approval has been obtained to retain $3.6 million, reducing the underspend to $1 million, which is less than 0.1% of our total projected expenses. Given a disruptive year in a constrained fiscal environment this is a good financial result, however it presents challenges looking forward as we balance commodity volatility pressure and muster pressure.
The revenue received by Corrections was $1.2 billion, which was $3.9 million above the supplementary estimates mainly due to:
- the recognition of a gain on the Tongariro/Rangipo land sale
- higher than targeted forestry logging volumes and additional livestock sales, partly offset by
- a reduction in Fonterra’s milk prices to $4.40/kg from $4.70/kg, and
- the pending insurance claim final settlement relating to the 2013 Spring Hill Corrections Facility riot.
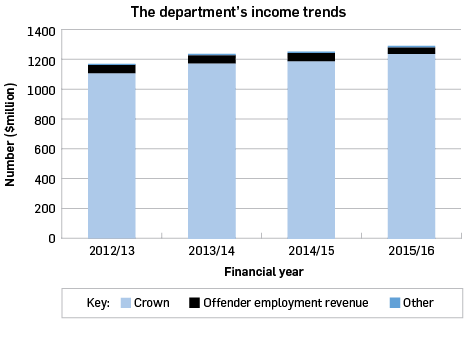
While our income is predominantly provided by the Crown we also generate a small revenue stream from our offender employment activities such as farming, forestry, distribution and industry activities.
During 2014/15 Corrections recognised $4.5 million of insurance proceeds revenue relating to settlement of claims for the 2012 Christchurch earthquake ($3.3 million) and the 2013 Spring Hill Corrections Facility riot ($1.2 million). Approval has been sought to retain this revenue for recovery of costs incurred in previous years.
Income
The graph below illustrates the sources of the department’s revenue.
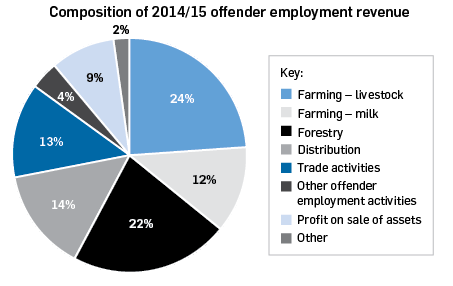
The graph below illustrates the composition of offender employment revenue as shown in the income trends graph by activity.
Expenditure by cost category
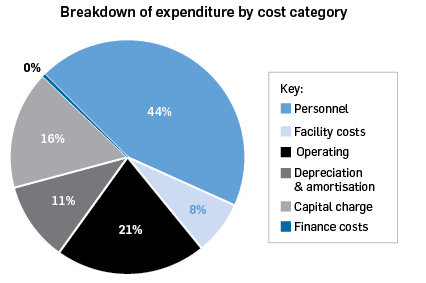
Nearly 80% of our $1.2 billion spend in 2014/15 related to workforce and asset ownership costs.
We employ nearly 8,000 people which results in a $544.1 million wages bill that makes up 44% of our total spend. A significant portion of the workforce is specialised and we make a considerable investment in upfront and ongoing training.
Expenditure by output
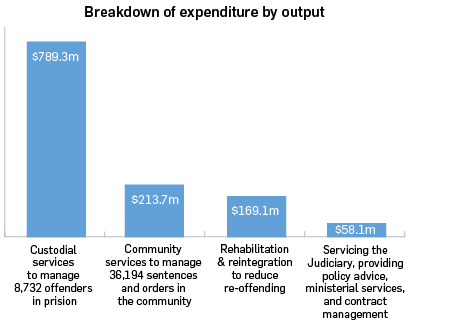
The graph below illustrates the outputs we delivered and the portion of expenditure incurred to deliver each output. By far the largest portion of our total spend goes to providing custodial services.
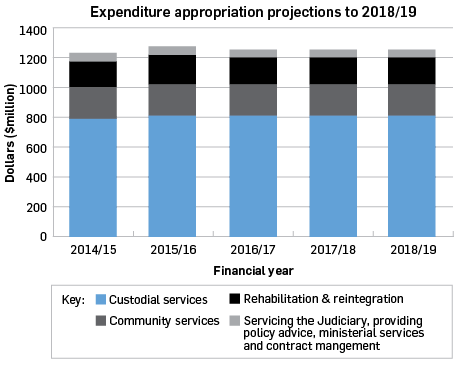
The graph below shows our output expenditure appropriation projections to 2018/19. We continue to manage our service within a constrained fiscal environment and are increasingly re-prioritising our resources to provide our services more efficiently and effectively within a fixed annual budget of $1.2 billion.
Asset base
We own $2,580 million of non-current assets that operate the length of the country, with many facilities operating 24 hours a day, seven days a week. Our non-current assets include:
- Property, plant and equipment – $2,487.6 million
- Assets related to offender employment activity including farming – $16.2 million
- Intangibles (software) including streamlined offender management systems – $76.2 million
Facility costs, depreciation and amortisation, capital charge and finance costs (Auckland South Corrections Facility PPP) represent 35% of our total 2014/15 spend.
Corrections’ asset base, which includes 18 prisons1, must be safe and secure, ensuring public safety is maintained and sentences are completed, while also enabling employment, training, skills development and rehabilitation opportunities for prisoners.
On 30 June 2015 the Tongariro/Rangipo forest crop and land were sold under a treaty settlement. Corrections managed the forest as part of its prisoner employment training programme. The treaty settlement has provided an opportunity for Corrections to relinquish some of its property holdings, freeing up cash and reducing commercial and operational risk while still retaining prisoner employment training opportunities.
Corrections continues to review the configuration of its prisons to ensure that within the network there is enough flexibility to adapt to the rising and changing prison population, including security classification of prisoners, age of prisoners, rehabilitative needs and maintaining proximity to the local courts.
Looking forward, Corrections has entered into an agreement with Next Step Partners to design, rebuild, finance and maintain the maximum security section of Auckland Prison under a Public Private Partnership. Custodial operations will continue to be carried out by Corrections. While the total maximum prisoner capacity will remain unchanged, the new modern facility will ensure the safe containment of prisoners and also ensure prisoners who have high and complex needs can receive care in an environment that supports them and the delivery of high quality rehabilitative and reintegrative services. Construction of the new maximum security facility is anticipated to begin in late 2015 and take two years to complete.
Capital expenditure
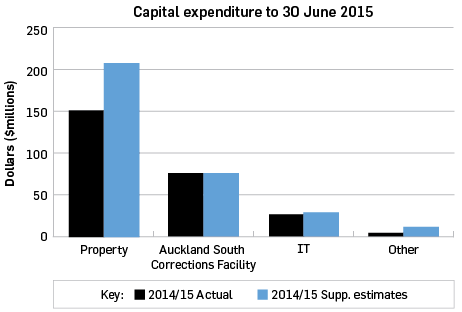
Corrections incurred $263.2 million of capital spend in 2014/15. This comprised $80.3 million to complete the Auckland South Corrections Facility, $151.8 million for property assets, $26 million on Information Technology and $5.1 million on other items such as fleet and plant replacements.
Property expenditure included $51.2 million for property projects, $55.5 million for prison development projects, $22.5 million for electronic security, $15.9 million for Community Corrections site developments and $6.7 million for minor works and asset replacements.
In particular, property expenditure included redevelopment works at Invercargill, Tongariro/Rangipo and Whanganui prisons, enhancements at Spring Hill Corrections Facility and Northland Region Corrections Facility, design and physical works at the refurbished section of Auckland Prison, the rollout of Audio-Visual Link (AVL) technology, the replacement and enhancement of electronic security systems and ongoing facilities lifecycle asset replacements.
Information technology (IT) expenditure included offender-centric initiatives such as technology to support the Administration of Community Sentences and Orders Bill (ACSOB), prisoner self-service kiosks, online learning and Integrated Offender Management System (IOMS) enhancements. Other IT expenditure included new management reporting tools and the rollout of new cellphone technology to support frontline staff.
The chart below shows actual capital expenditure against supplementary estimates by major portfolio. The overall underspend reflects changes in the mix and timing of projects due to a variety of reasons, including for property, scheduling changes due to muster pressures, tendering delays and securing appropriate sites for Community Corrections developments.
1. This figure includes two privately managed prisons (Auckland South Corrections Facility and Mount Eden Corrections Facility) operated through contracts with SecureFuture and Serco respectively.

