Making a difference in a challenging environment
The Department of Corrections operates in a highly dynamic context, and we are able to respond to the challenges that we are faced with.
The Department of Corrections has robust systems in place to respond to challenges
The prison population has consistently increased since 1985, and has more than doubled from 4,079 prisoners in 1996 to 9,532 as at 30 June 2016. Corrections’ asset planning has always included resilience to adjust for unforeseen circumstances, as well as allowing for growth in the prison population.
A large proportion of the rising prisoner population has been driven by remand prisoners (offenders awaiting either trial or sentencing), who are held in high security facilities and separated from sentenced prisoners.
Corrections has a dynamic prisoner placement process and, with careful planning around where and how remand prisoners are held, we have ensured that all prisoners have been accommodated appropriately throughout the year while maintaining high levels of public safety.
To accommodate growth in the short term, Corrections has undertaken a capital programme to reconfigure some prisons, expand double bunking and introduce additional units to increase capacity by 374 beds over the next 12 months.
Achieving our goals of reducing re-offending and ensuring a safe and secure corrections system, relies largely on the efforts of frontline staff. With the increasing prison population it is imperative that we continue to recruit and retain high quality staff who wish to change lives and shape futures, and who can provide the services required to rehabilitate prisoners successfully.
Rehabilitation programmes that are designed and delivered effectively, and that are known to work, are key to reducing re-offending. During 2015/16 we increased our focus through the RR25% Boost programme in order to reach a larger proportion of the offender base by expanding services such as short programmes targeting violent offenders, intensive alcohol and drug treatment and family violence programmes in prisons and through the development of a new parenting skills programme.
The resilience of Corrections, both in terms of the physical infrastructure and our people, was demonstrated with the response to events at Mount Eden Corrections Facility and our work to monitor and manage offenders deported from overseas.
The demographics of the prison population have changed
Corrections has managed a changing offender population over the last five years, as the balance between prison and community-based sentences has shifted. Traffic and dishonesty offences are now more likely to receive sentences such as home detention, and more supervision orders are being imposed for serious offences. This has been enabled by the use of electronic monitoring (EM), as advances in technology have allowed more proactive monitoring of sentences and orders in the community.
Proactive monitoring requires effective responses when offenders breach their conditions, and this financial year has seen the introduction of higher levels of GPS monitoring through the 3M contract supplemented by the creation of the GPS Immediate Response Team and the EM Assurance Team, which provide an intensive level of monitoring and accelerated responses for offenders serving sentences in the community.
These changes have made community-based sentences available for more offenders, meaning that a larger part of the prison population consists of more serious or repeat offenders.
The impact of sentence lengths
The relative numbers of prisoners serving sentences of different lengths is a significant factor in our management of the prison network. The following graph outlines the numbers of prisoners serving sentences of particular lengths, from June 2012 to June 2016.
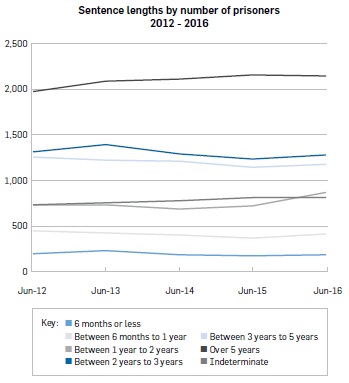
As shown in the graph, the number of prisoners serving sentences of under two years makes up a significant portion of the overall prison population, and has increased over the last 12 months. In order to effectively manage short serving sentences it is imperative that rehabilitative needs are identified in a timely manner to ensure that these interventions can be completed. During 2015/16 Corrections ensured that over 80% of prisoners started and completed a rehabilitation programme. In addition, the focus of the RR25% Boost programme has ensured that more interventions were targeted towards short term sentences.
With over 15,700 prisoners received into custody in 2015/16, significant work resource has been targeted towards offenders beginning sentences, through offender plans and health assessments, and at the completion of sentences through reintegration services.
Additional demands created by returning offenders
From November 2015, Corrections began to have responsibility for some offenders returning from Australia, 180 of whom are now subject to the Returning Offenders (Management and Information) Act 2015. Corrections’ dedicated team works alongside NZ Customs, NZ Police, the Ministry of Social Development and the Prisoners Aid and Rehabilitation Society network, to ensure that offenders are aware of the obligations of their order and to offer them reintegrative support.
Mount Eden Corrections Facility
Following a number of serious allegations involving the management of the privately-run Mount Eden Corrections Facility (MECF), Corrections invoked the ‘Step-In’ clause in our contract with Serco in July 2015. This allowed Corrections to install our own prison director and management team into MECF, to oversee day-to-day operations. Since July 2015, there has been an average of 45 Corrections’ staff located at MECF every day.
MECF is a critical part of the overall prison network, as it provides approximately 34% of remand capacity. Maintaining operations at MECF is essential, and Corrections proactively mobilised staff from around the country to ensure that stability on the site was restored while balancing the needs of the entire prison network.
An agreement with Serco was announced in April 2016, which has Corrections managing MECF with Serco providing staff and transition services until the end of the contract in March 2017, at which time Corrections will take over full operations at the site. Serco paid Corrections $8 million in settlement of cost associated with the Step-In as part of the agreement.
Challenges in reducing re-offending
The number of offenders who re-offend has been declining over the past five years, with almost 25% fewer re-offenders in the system than in 2011.
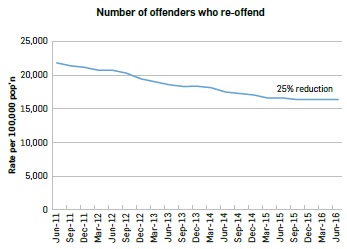
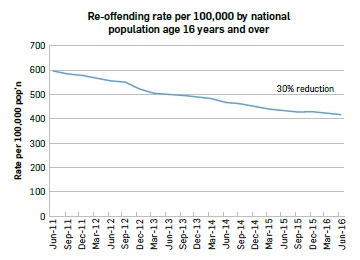
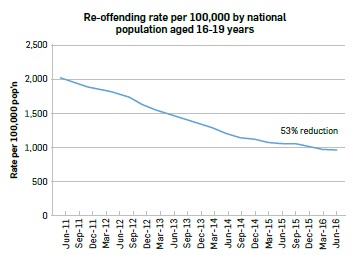
At a population level the rate of re-offending over the past five years for all people aged 16 and over has steadily declined, importantly with even steeper declines in the 16 to 19 year population.
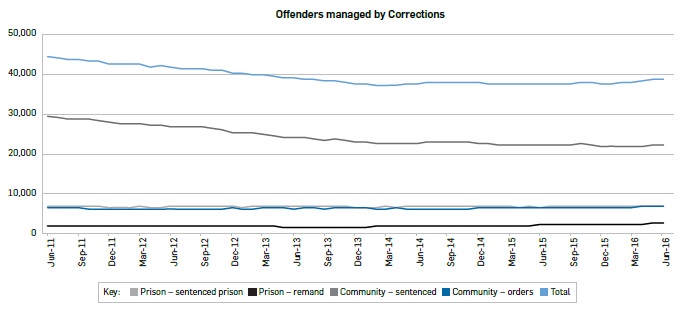
The total number of offenders under Corrections management has also declined over the five year period, with a reduction in offenders serving community-based sentences outweighing the increases in imprisonment.
While overall numbers of offenders entering the Corrections system has been reducing, those that are under sentence are more recidivist and higher-risk. Effective targeting of policing activities resulting in improved prosecution and conviction rates has been successful in ensuring offenders who commit the most serious crimes are those who are in prison.
The reduction in the rate of re-offending was 5.6% at 30 June 2016 (refer to Appendix One). That measure combines the rate of reimprisonment among prisoners within 12 months of their release, and the rate of reconviction among offenders serving community-based sentences within 12 months of the start of their sentence.
Mental health
Offenders have higher mental health needs than the general population, with a recent Corrections study showing that anxiety, panic, post-traumatic stress and mood disorders are significantly more prevalent among offenders than among the general population. Effectively managing these conditions can create a broad spectrum of benefits to society, to the offenders themselves and to Corrections. If offender health needs are not addressed then offenders can have difficulty complying with their conditions, completing their sentences and engaging in rehabilitation. In June 2016, Corrections secured additional Justice Sector funding of $14 million to improve mental health services for offenders over the next two years. This is in addition to the packages of care that are currently at all prison sites for prisoners with mild to moderate mental health needs, and mental health in-reach clinicians at three prison sites.
Gangs
Corrections is part of the Whole of Government Gangs Action Plan, which was initiated in 2014 to reduce the harm that gangs cause to families and communities. Offenders with gang connections are twice as likely to re-offend compared to prisoners with non-gang affiliations, and are prone to re-offend with increased seriousness.
Corrections provides exit pathways to offenders who want to end their involvement with a gang. This can involve moving to a new area, building alternative support networks and accessing services such as gang-related tattoo removal. Pathways to exit gangs can also form part of a broader suite of rehabilitative interventions, which support offenders to build sustainable and law-abiding lifestyles.
Prisoners with gang affiliations commit a disproportionate number of assaults in prisons. In 2015, gang affiliated prisoners were responsible for just over half (55%) of assaults despite comprising 29% of the prison population. Gangs also play a significant role in the introduction of contraband to Corrections sites. The introduction of prohibited items or substances can undermine the security, integrity and safety of prisons, and can present significant challenges to prisoners who are working to resolve issues such as substance abuse. Our range of anti-contraband activities, including cell searches, drug tests, detector dogs and scanning of visitors to prisons, all help to reduce the accessibility of and harm caused by contraband, and can reduce the influence of gangs within the prison system.

