Our people
Corrections is an equal opportunity employer, and we work on retaining and developing our workforce.
Diversity
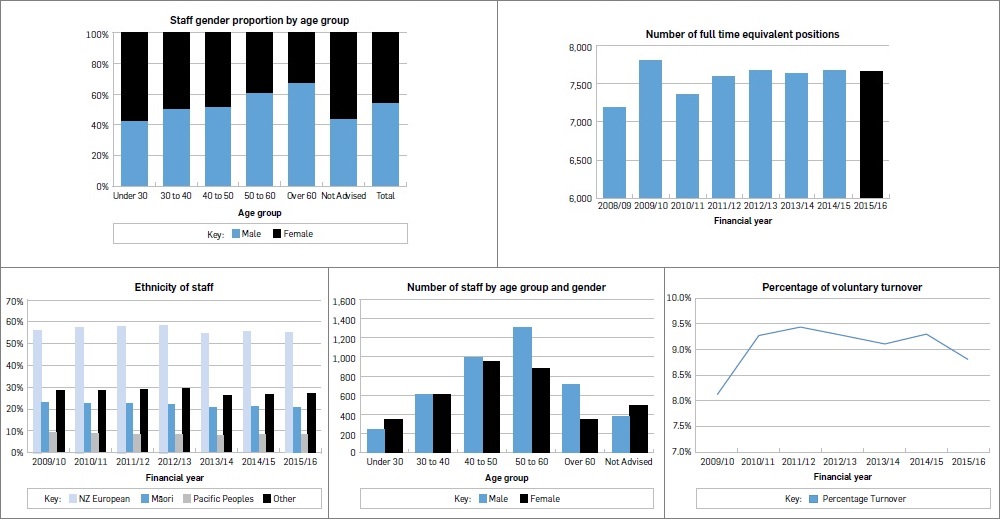
Māori and Pacific peoples continue to be over-represented in the Corrections system. As such, it is important for Corrections to ensure that our staff are representative of the full spectrum of the offender population.
More than 20% of staff identified as Mäori in 2015/16, and approximately 9% as Pacific Peoples. A high number of staff identify themselves as having a multi-ethnic background, and this is reflected in the high level of the ‘other’ category8.
Turnover
Voluntary turnover at Corrections was just below 9% in 2015/16. This rate has remained between 9% and 10% for the past five years, so dropping below 9% is a notable change.
Turnover is not currently a cause for concern and is below average levels for the Public Sector. This low level of turnover reflects Corrections’ emphasis on valuing and developing our staff, and the sense of achievement that can come from work that keeps communities safe and working to improve the lives of New Zealanders.
Pay equality
The gender pay gap at Corrections was approximately 2% in 2015/16. This is significantly below the Public Sector average of 14%, and is consistent with Corrections’ results over the previous five years.
Driving continuous improvement: The Well Functioning Site Framework
The Well Functioning Site (WFS) framework is a strengths-based approach to completing a review of the quality of our practice and performance at each site. The aim is to support the development and strengthening of high functioning teams and sites. Strengths-based means that the evaluation looks at what is done well, and at the areas that need developing and/or improving. The framework assists senior leaders to look beneath the presenting issues to understand the drivers and barriers for quality practice. It is designed for the local sites to assist their learning and create a culture of continuous improvement.
The framework covers four domains that focus on how effective we are being for offenders, how well we are supporting staff, how we work in collaboration with the community and how we are perceived by that community. The framework has a clearly defined process and assessment criteria, and is run over one week with reports provided to the relevant site manager, Regional Commissioner and National Office senior leaders.

8 The percentages for each year in the graph will add up to more than 100%, because staff can identify as more than one ethnicity.

